3.4 Plotting Sample Fragment Size Distribution and TSS Enrichment Profiles.
Because of how the data is stored and accessed, ArchR can compute fragment size distributions and TSS enrichment profiles from Arrow files very quickly.
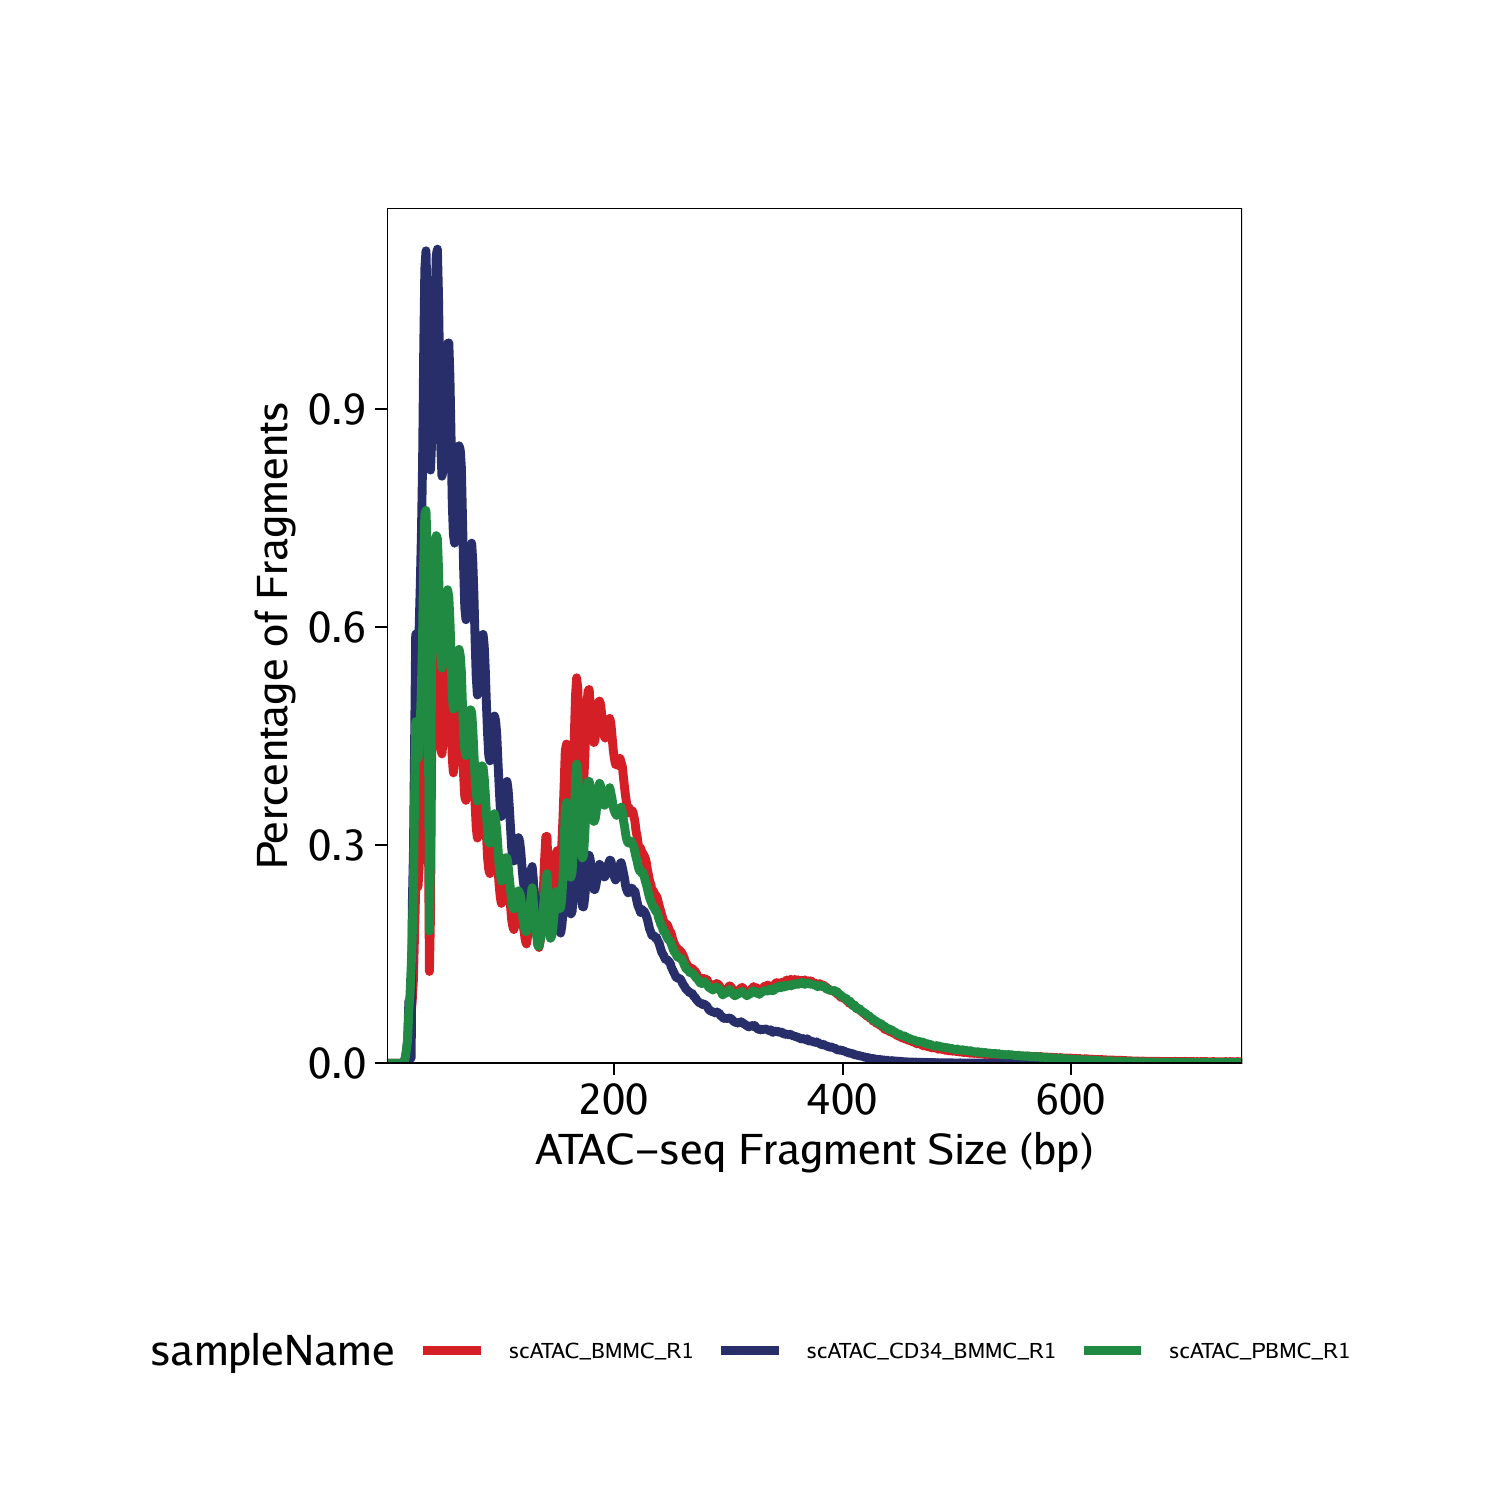
Fragment size distributions
To plot the fragment size distributions of all samples, we use the plotFragmentSizes() function. Fragment size distributions in ATAC-seq can be quite variable across samples, cell types, and batches. Slight differences like those shown below are common and do not necessarily correlate with differences in data quality.
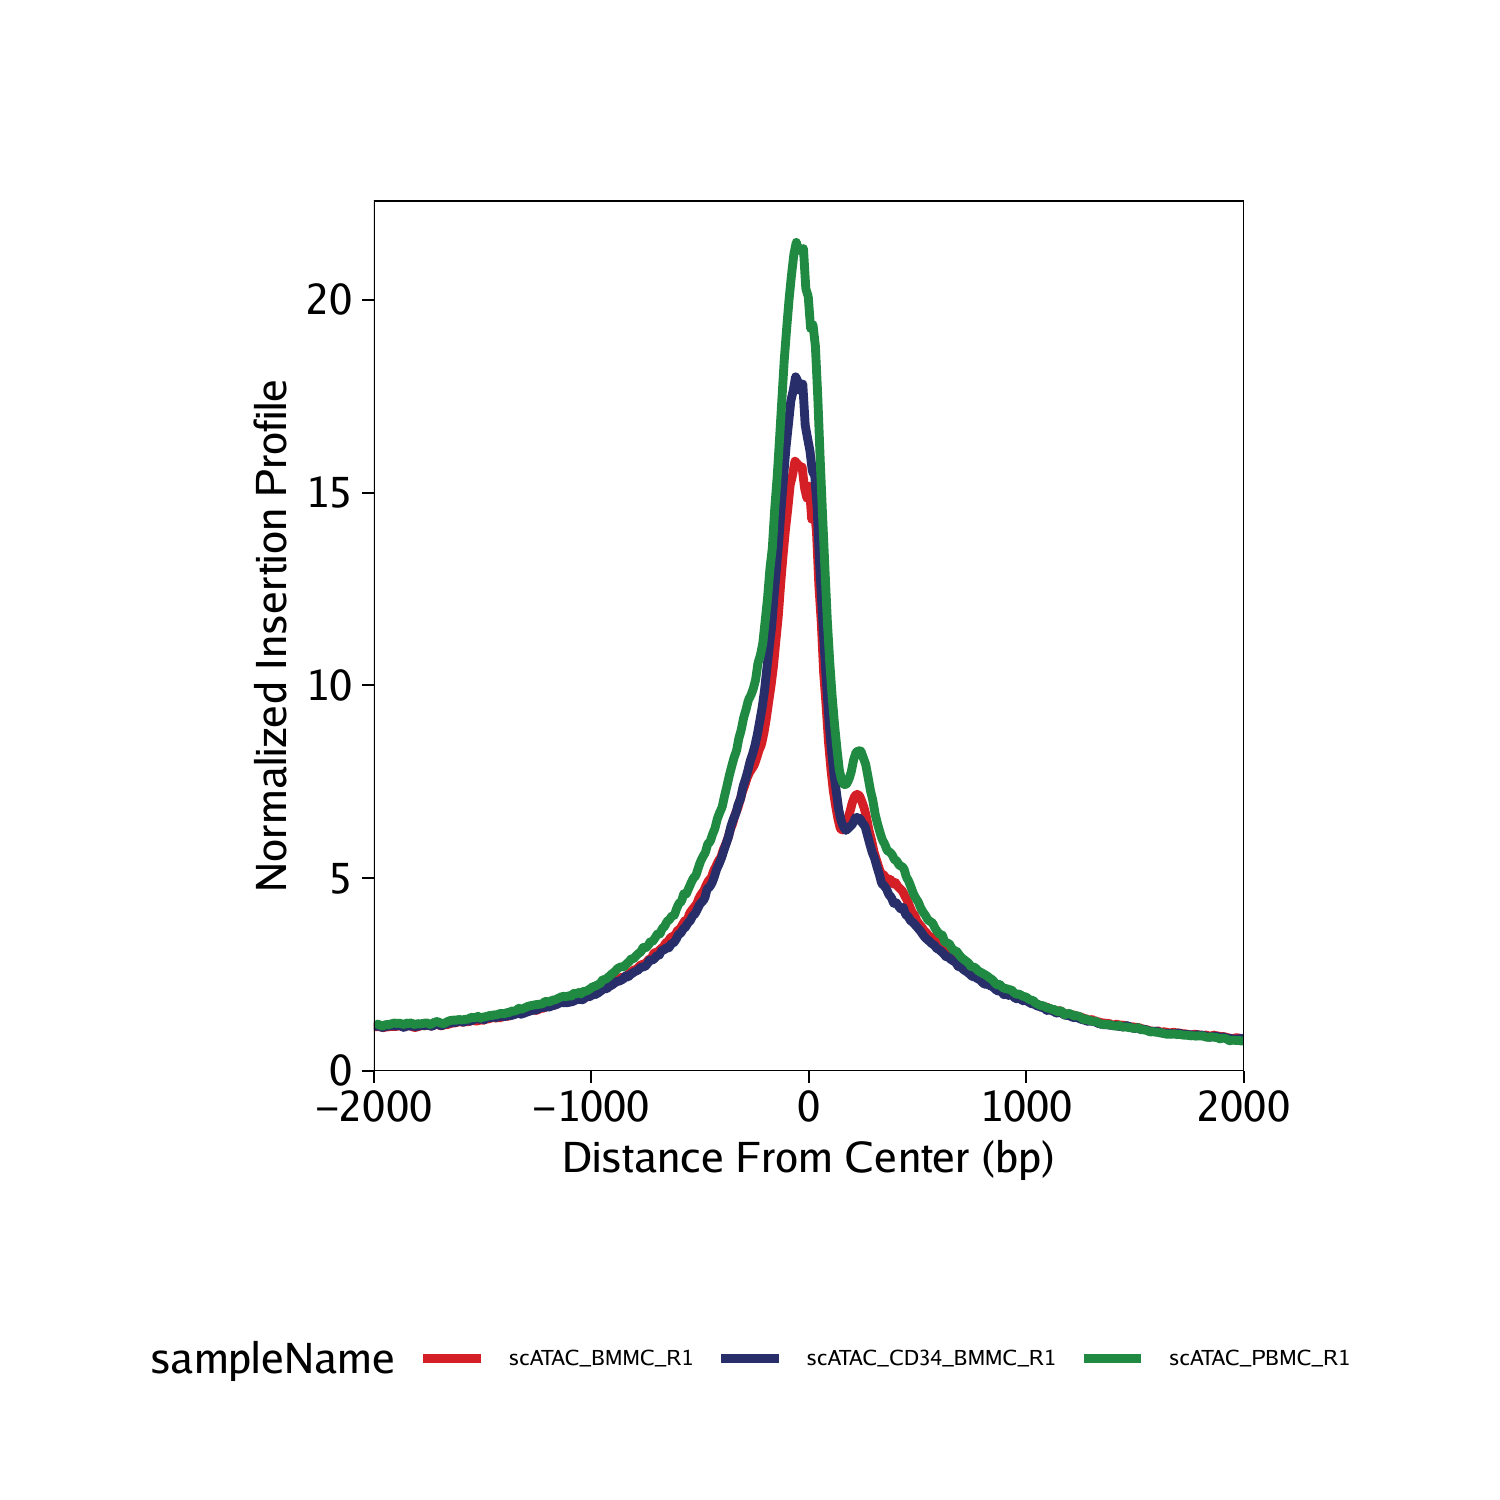
TSS enrichment profiles
To plot TSS enrichment profiles, we use the plotTSSEnrichment() function. TSS enrichment profiles should show a clear peak in the center and a smaller shoulder peak right-of-center which is caused by the well-positioned +1 nucleosome.
To save editable vectorized versions of these plots, we use plotPDF().
plotPDF(p1,p2, name = "QC-Sample-FragSizes-TSSProfile.pdf", ArchRProj = projHeme1, addDOC = FALSE, width = 5, height = 5)## [1] “plotting ggplot!”
## [1] “plotting ggplot!” ## [1] 0