Chapter 15 ChromVAR Deviatons Enrichment with ArchR
As shown in previous chapters, TF motif enrichments can help us predict which regulatory factors are most active in our cell type of interest. These enrichments, however, are not calculated on a per-cell basis and they do not take into account the insertion sequence bias of the Tn5 transposase. chromVAR, an R package from the Greenleaf Lab, was created to account for these issues. chromVAR is designed for predicting enrichment of TF activity on a per-cell basis from sparse chromatin accessibility data. The two primary outputs of chromVAR are:
- “deviations” - A deviation is a bias-corrected measurement of how far the per-cell accessibility of a given feature (i.e motif) deviates from the expected accessibility based on the average of all cells or samples. Deviations are computed per-cell and independent of the sample.
- “z-score” - The z-score, also confusingly known as a “deviation score” is the z-score for each bias-corrected deviation across all cells. The absolute value of the deviation score is correlated with the per-cell read depth. This is because, with more reads, you have higher confidence that the difference in per-cell accessibility of the given feature (i.e. motif) from the expectation is greater than would occur by chance.
One of the primary limitations of chromVAR is that it was designed during the early era of scATAC-seq data generation when an experiment consisted of a few hundred of cells. At this experimental scale, chromVAR could easily read the entire cell-by-peak matrix into memory to quickly compute TF deviations. However, current experimental approaches use tens to hundreds of thousands of cells, generating cell-by-peak matrices that are much more difficult to read into memory. This leads to dramatic increases in run time and memory usage for even moderately sized datasets of 50,000 cells.
To circumvent these limitations, ArchR implements the same chromVAR analysis workflow by analyzing sample sub-matrices independently. Additionally, as of release_1.0.3 ArchR also includes a re-implementation of some of the core chromVAR functionality in C++ using Rcpp. Together, this enables application of chromVAR to very large datasets.
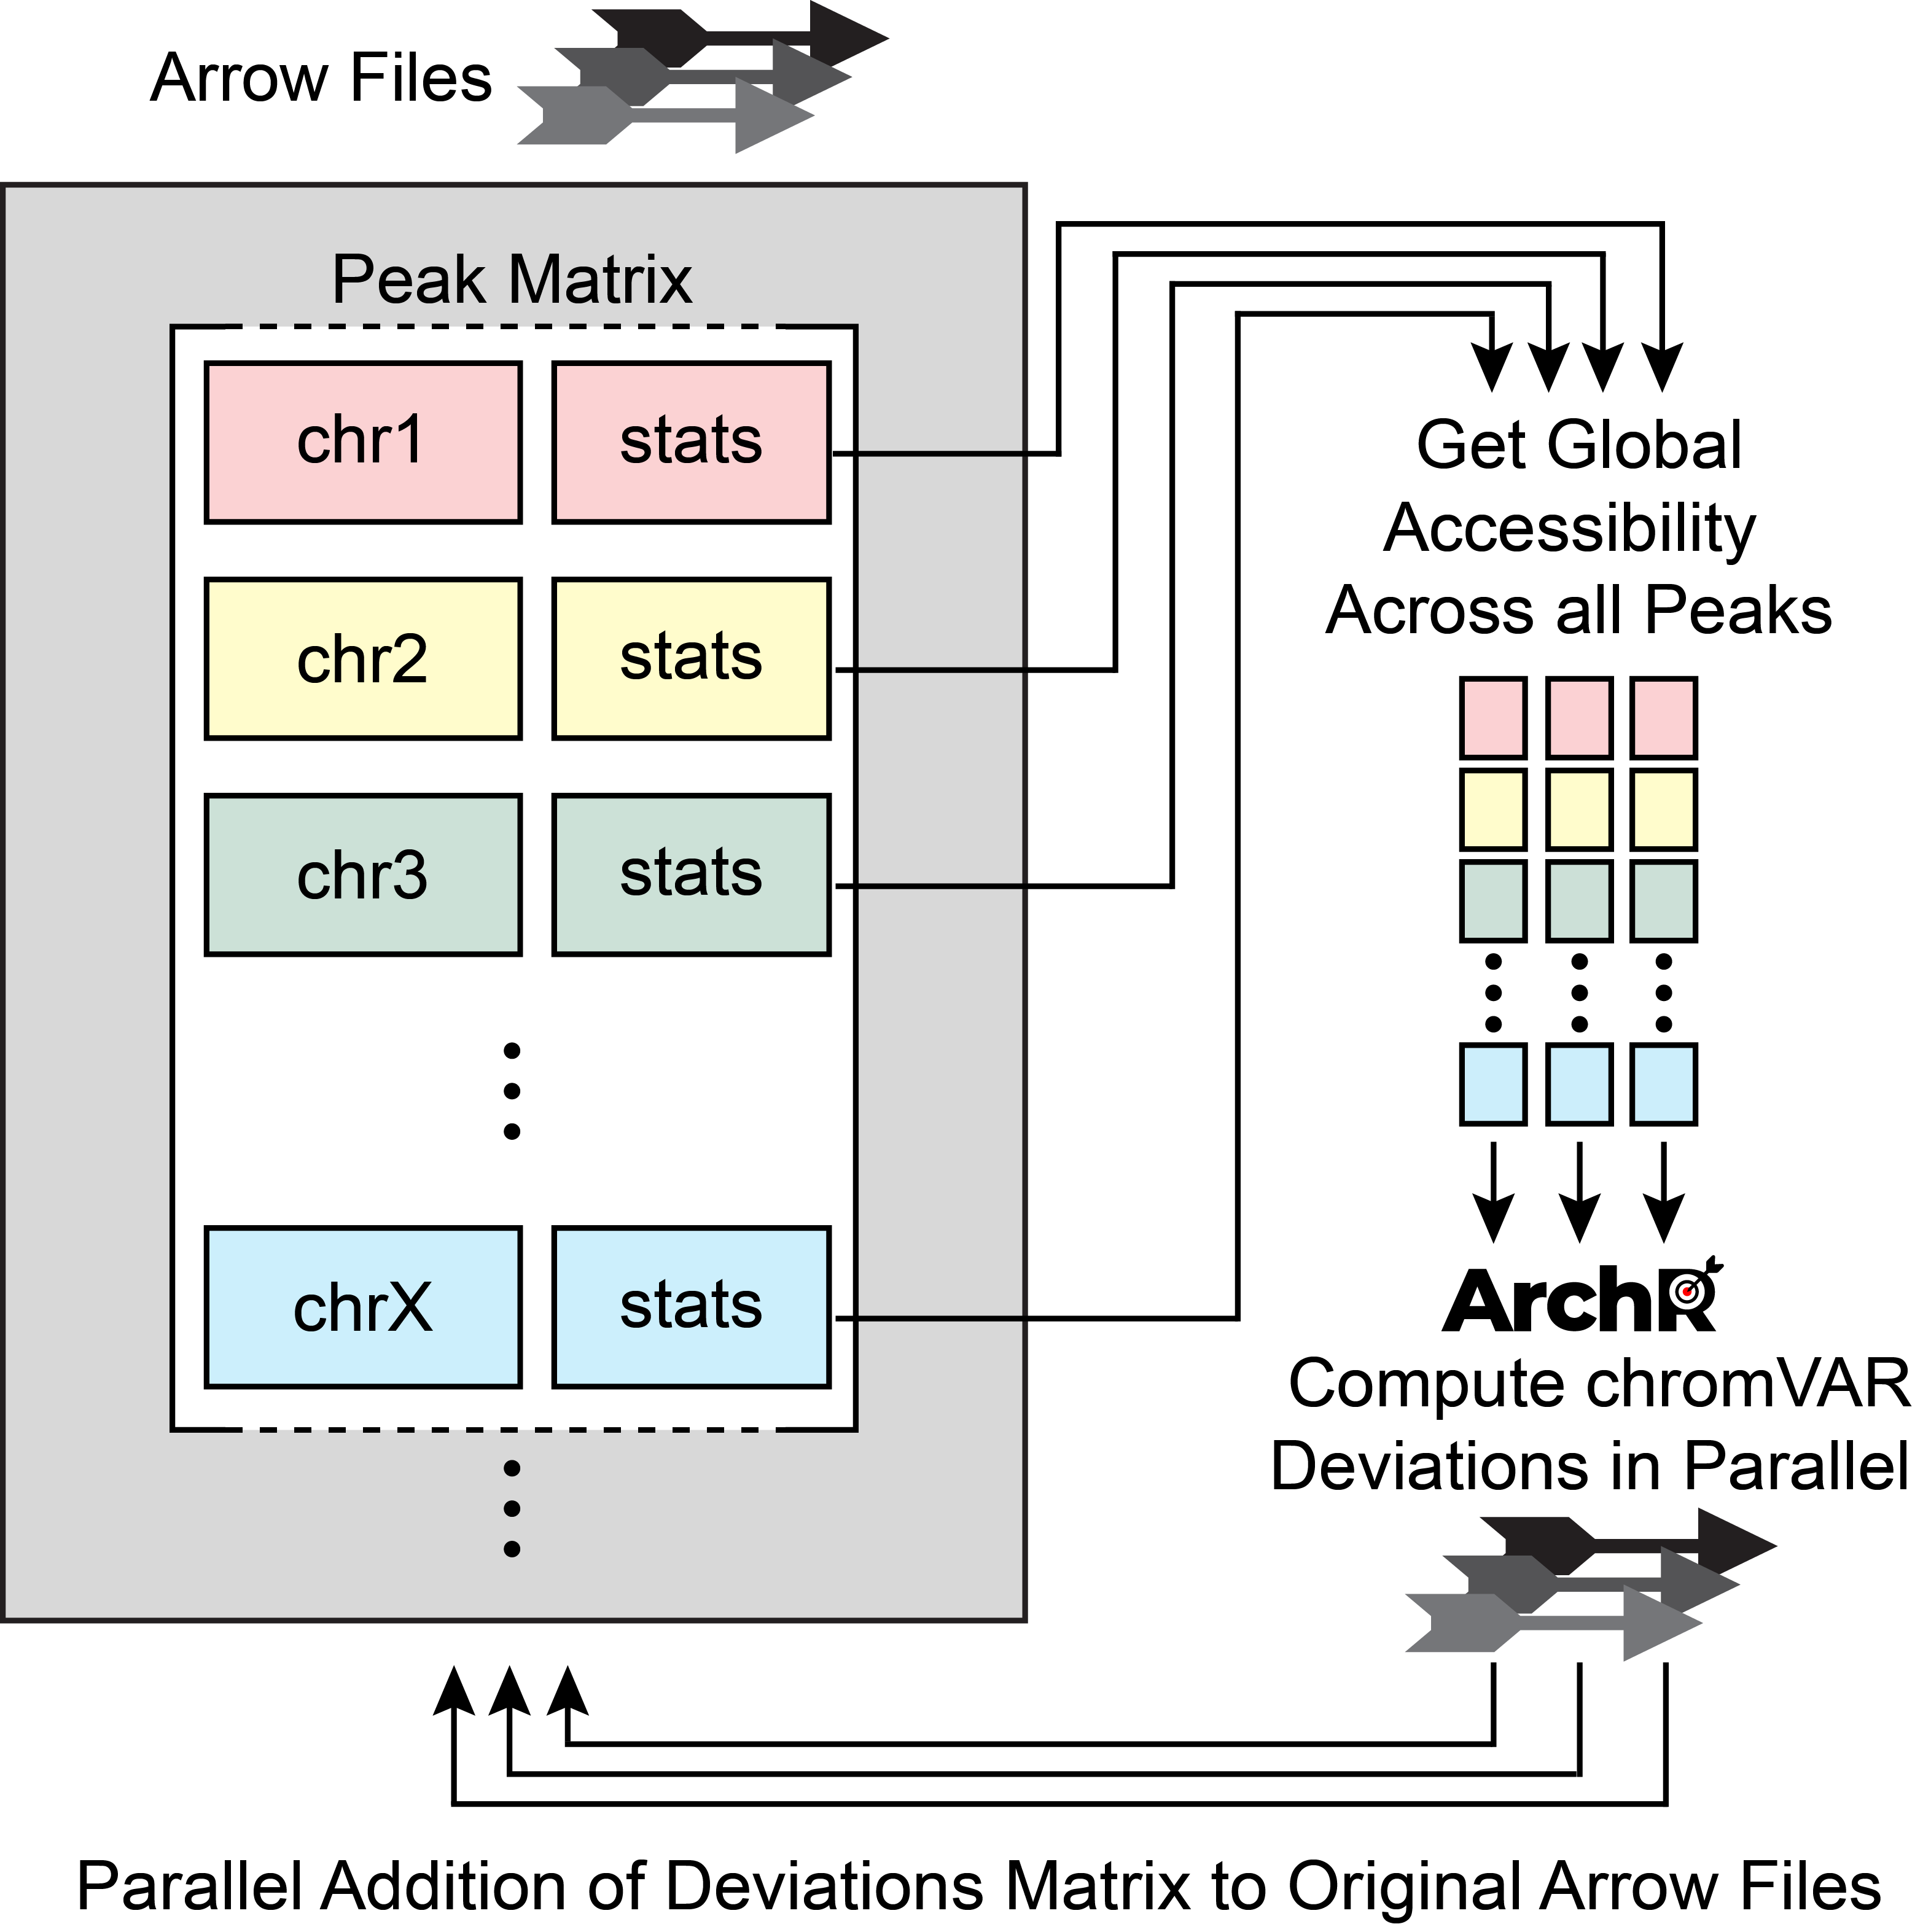
First, ArchR reads in the global accessibility per peak across all cells in each sub-sample. Second, for each peak, ArchR identifies a set of background peaks that are matched by GC-content and accessibility. Third, ArchR uses this background set of peaks and global accessibility to compute bias-corrected deviations with chromVAR for each sample independently. This implementation requires data from only 5,000-10,000 cells to be loaded into memory at any given time, minimizing the memory requirements, enabling scalable analysis with chromVAR, and improving run-time performance.