3.7 Per-cell Quality Control
Strict quality control (QC) of scATAC-seq data is essential to remove the contribution of low-quality cells. In ArchR, we consider three characteristics of data:
- The number of unique nuclear fragments (i.e. not mapping to mitochondrial DNA).
- The signal-to-background ratio. Low signal-to-background ratio is often attributed to dead or dying cells which have de-chromatinzed DNA which allows for random transposition genome-wide.
- The fragment size distribution. Due to nucleosomal periodicity, we expect to see depletion of fragments that are the length of DNA wrapped around a nucleosome (approximately 147 bp).
The first metric, unique nuclear fragments, is straightforward - cells with very few usable fragments will not provide enough data to make useful interpretations and should therefore be excluded.
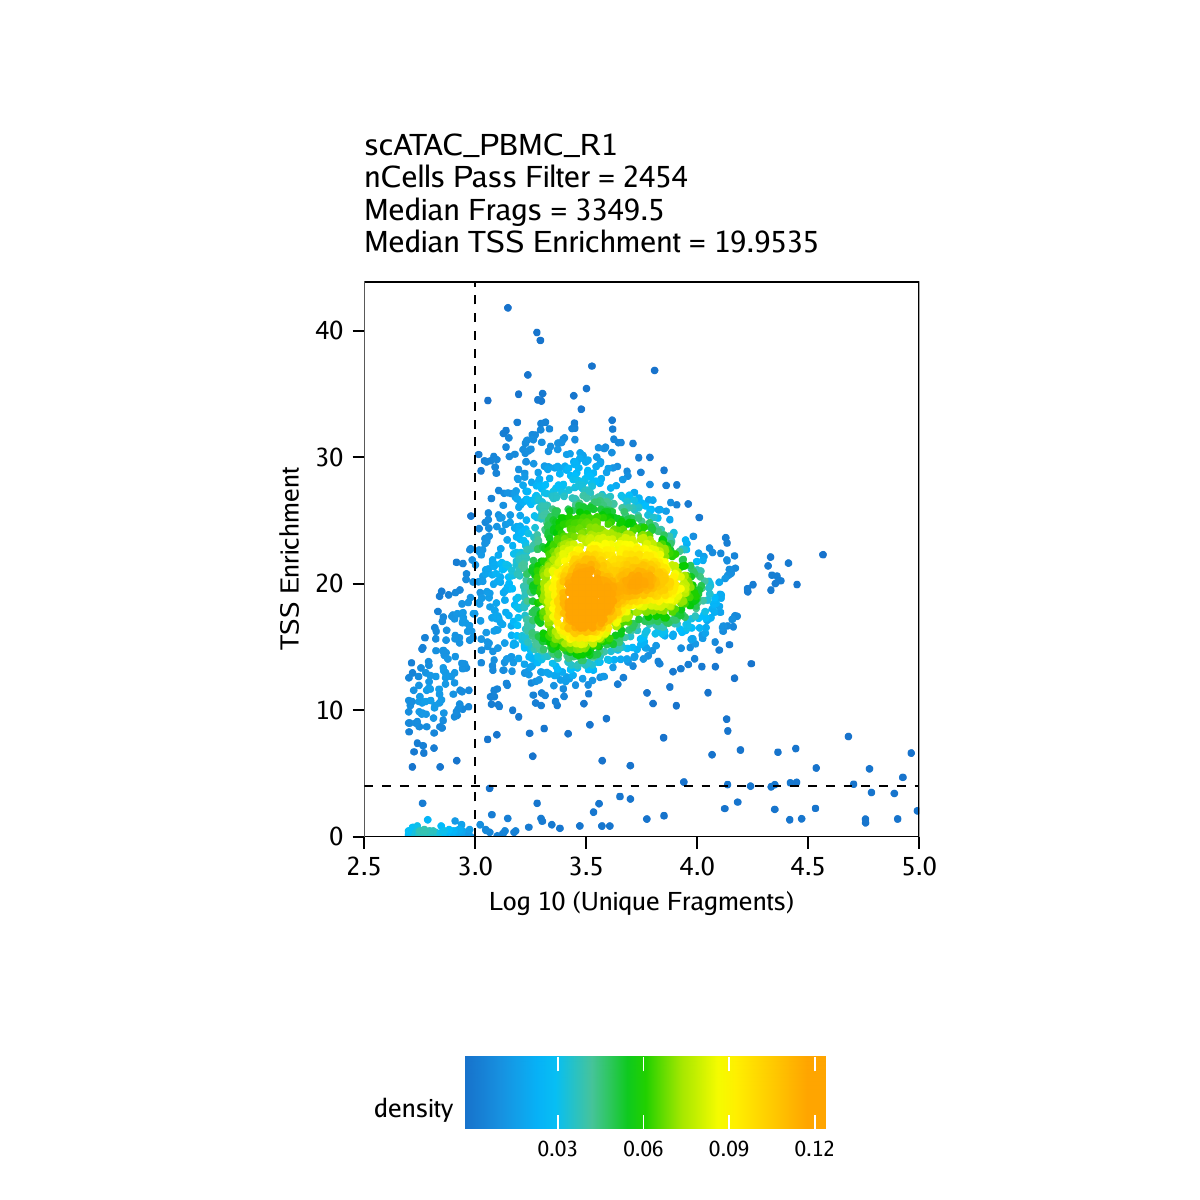
The second metric, signal-to-background ratio, is calculated as the TSS enrichment score. Traditional bulk ATAC-seq analysis has used this TSS enrichment score as part of a standard workflow for determination of signal-to-background (for example, the ENCODE project). We and others have found the TSS enrichment to be representative across the majority of cell types tested in both bulk ATAC-seq and scATAC-seq. The idea behind the TSS enrichment score metric is that ATAC-seq data is universally enriched at gene TSS regions compared to other genomic regions, due to large protein complexes that bind to promoters. By looking at per-basepair accessibility centered at these TSS regions, we see a local enrichment relative to flanking regions (1900-2000 bp distal in both directions). The ratio between the peak of this enrichment (centered at the TSS) relative to these flanking regions represents the TSS enrichment score.
Traditionally, the per-base-pair accessibility is computed for each bulk ATAC-seq sample and then this profile is used to determine the TSS enrichment score. Performing this operation on a per-cell basis in scATAC-seq is relatively slow and computationally expensive. To accurately approximate the TSS enrichment score per single cell, we count the average accessibility within a 50-bp region centered at each single-base TSS position and divide this by the average accessibility of the TSS flanking positions (+/- 1900 - 2000 bp). This approximation was highly correlated (R > 0.99) with the original method and values were extremely close in magnitude.
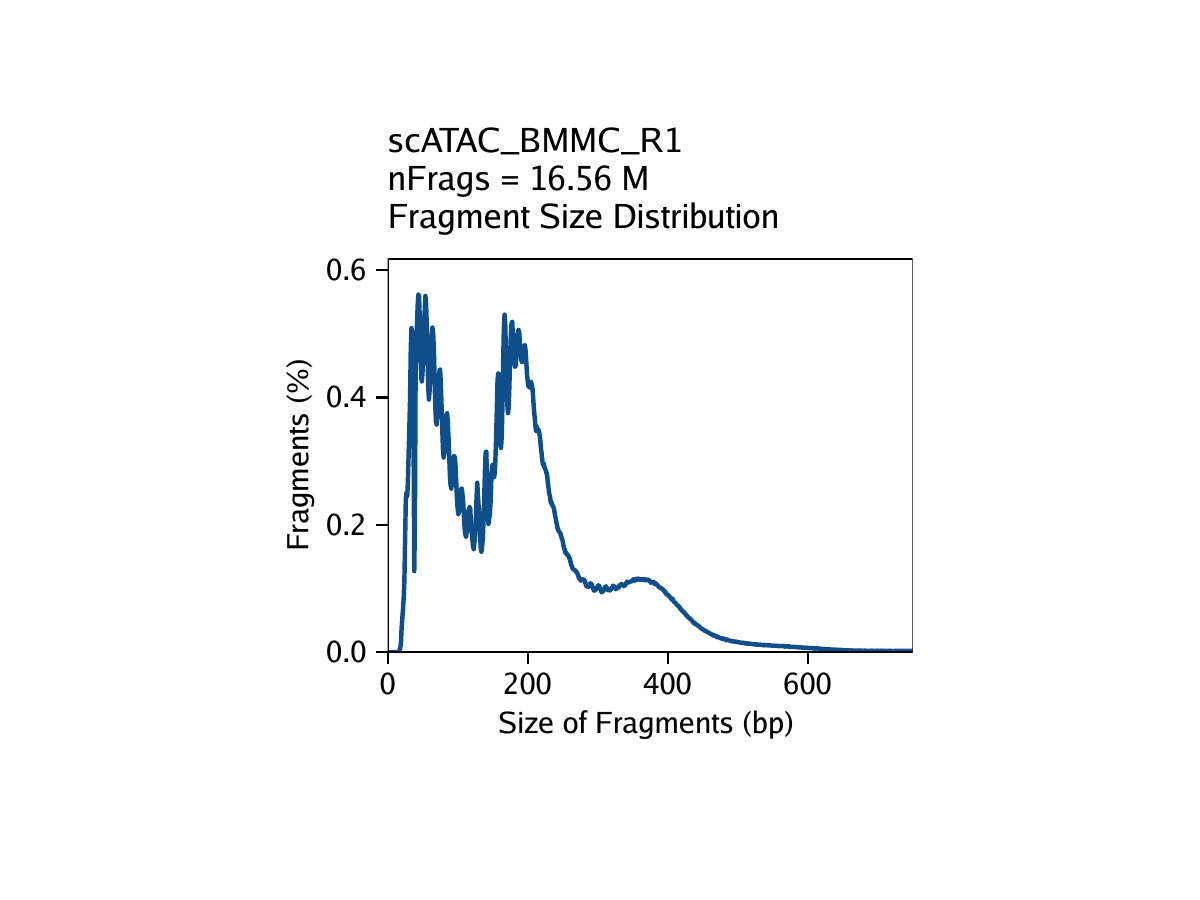
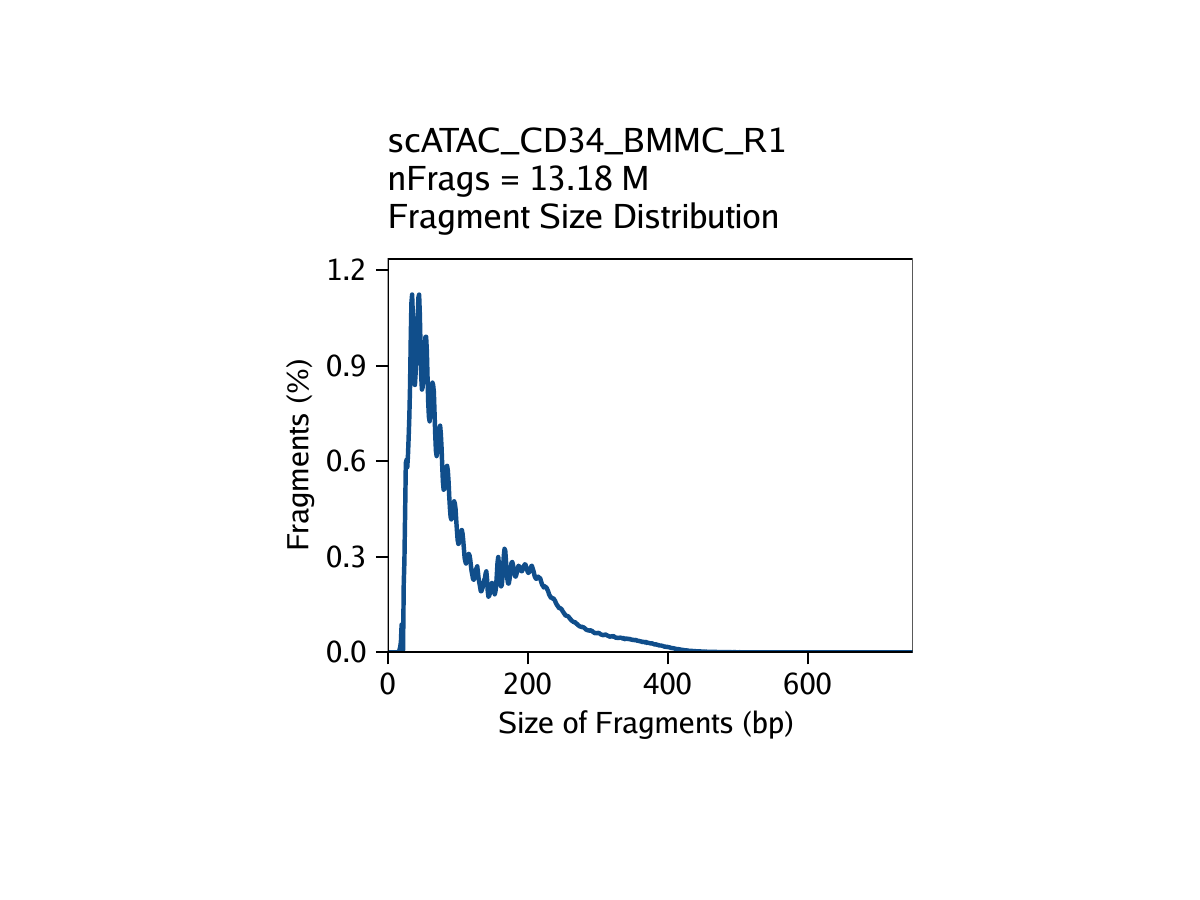
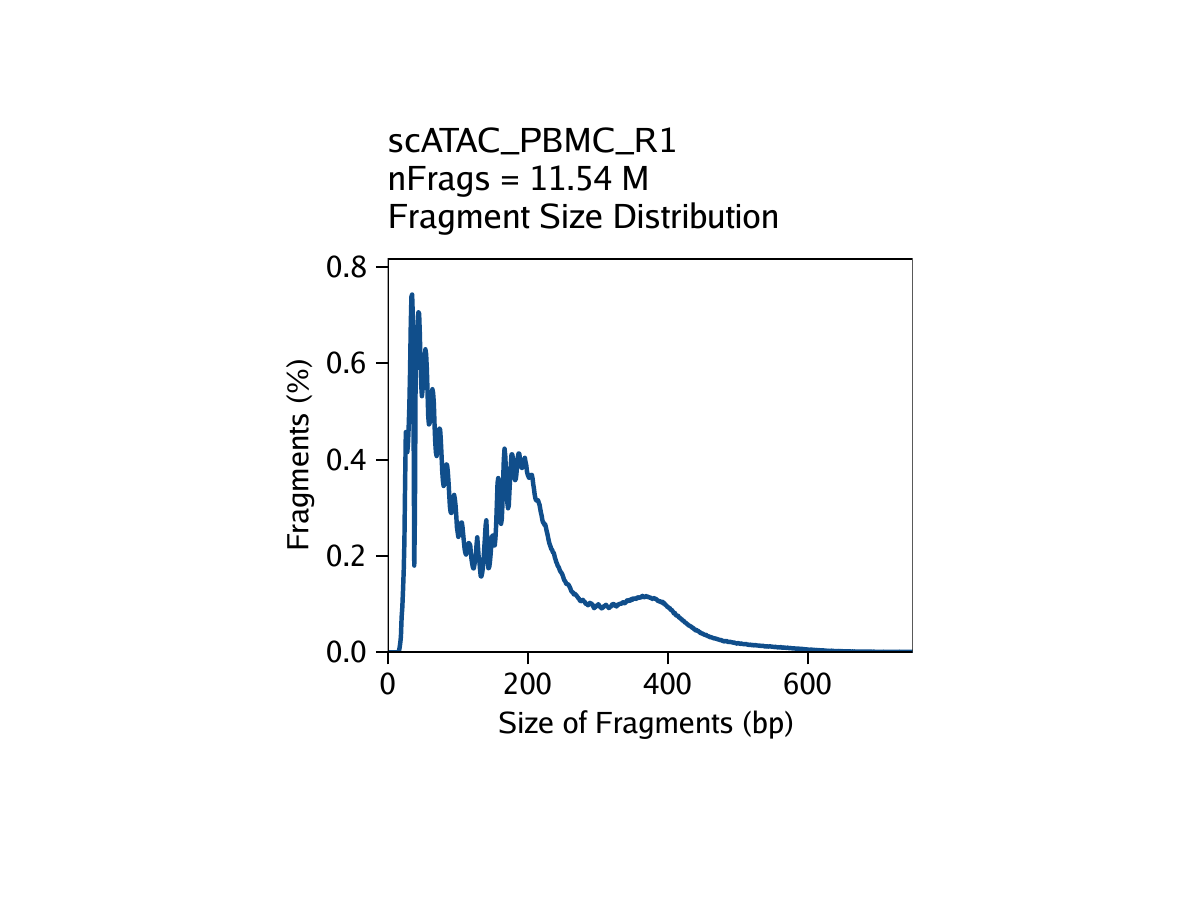
The third metric, fragment size distribution, is generally less important but always good to manually inspect. Because of the patterned way that DNA wraps around nucleosomes, we expect to see a nucleosomal periodicity in the distribution of fragment sizes in our data. These hills and valleys appear because fragments must span 0, 1, 2, etc. nucleosomes (Tn5 cannot cut DNA that is tightly wrapped around a nucleosome.
By default in ArchR, pass-filter cells are identified as those cells having a TSS enrichment score greater than 4 and more than 1000 unique nuclear fragments. It is important to note that the actual numeric value of the TSS enrichment score depends on the set of TSSs used. The default values in ArchR were designed for human data and it may be important to change the default thresholds when running createArrowFiles().
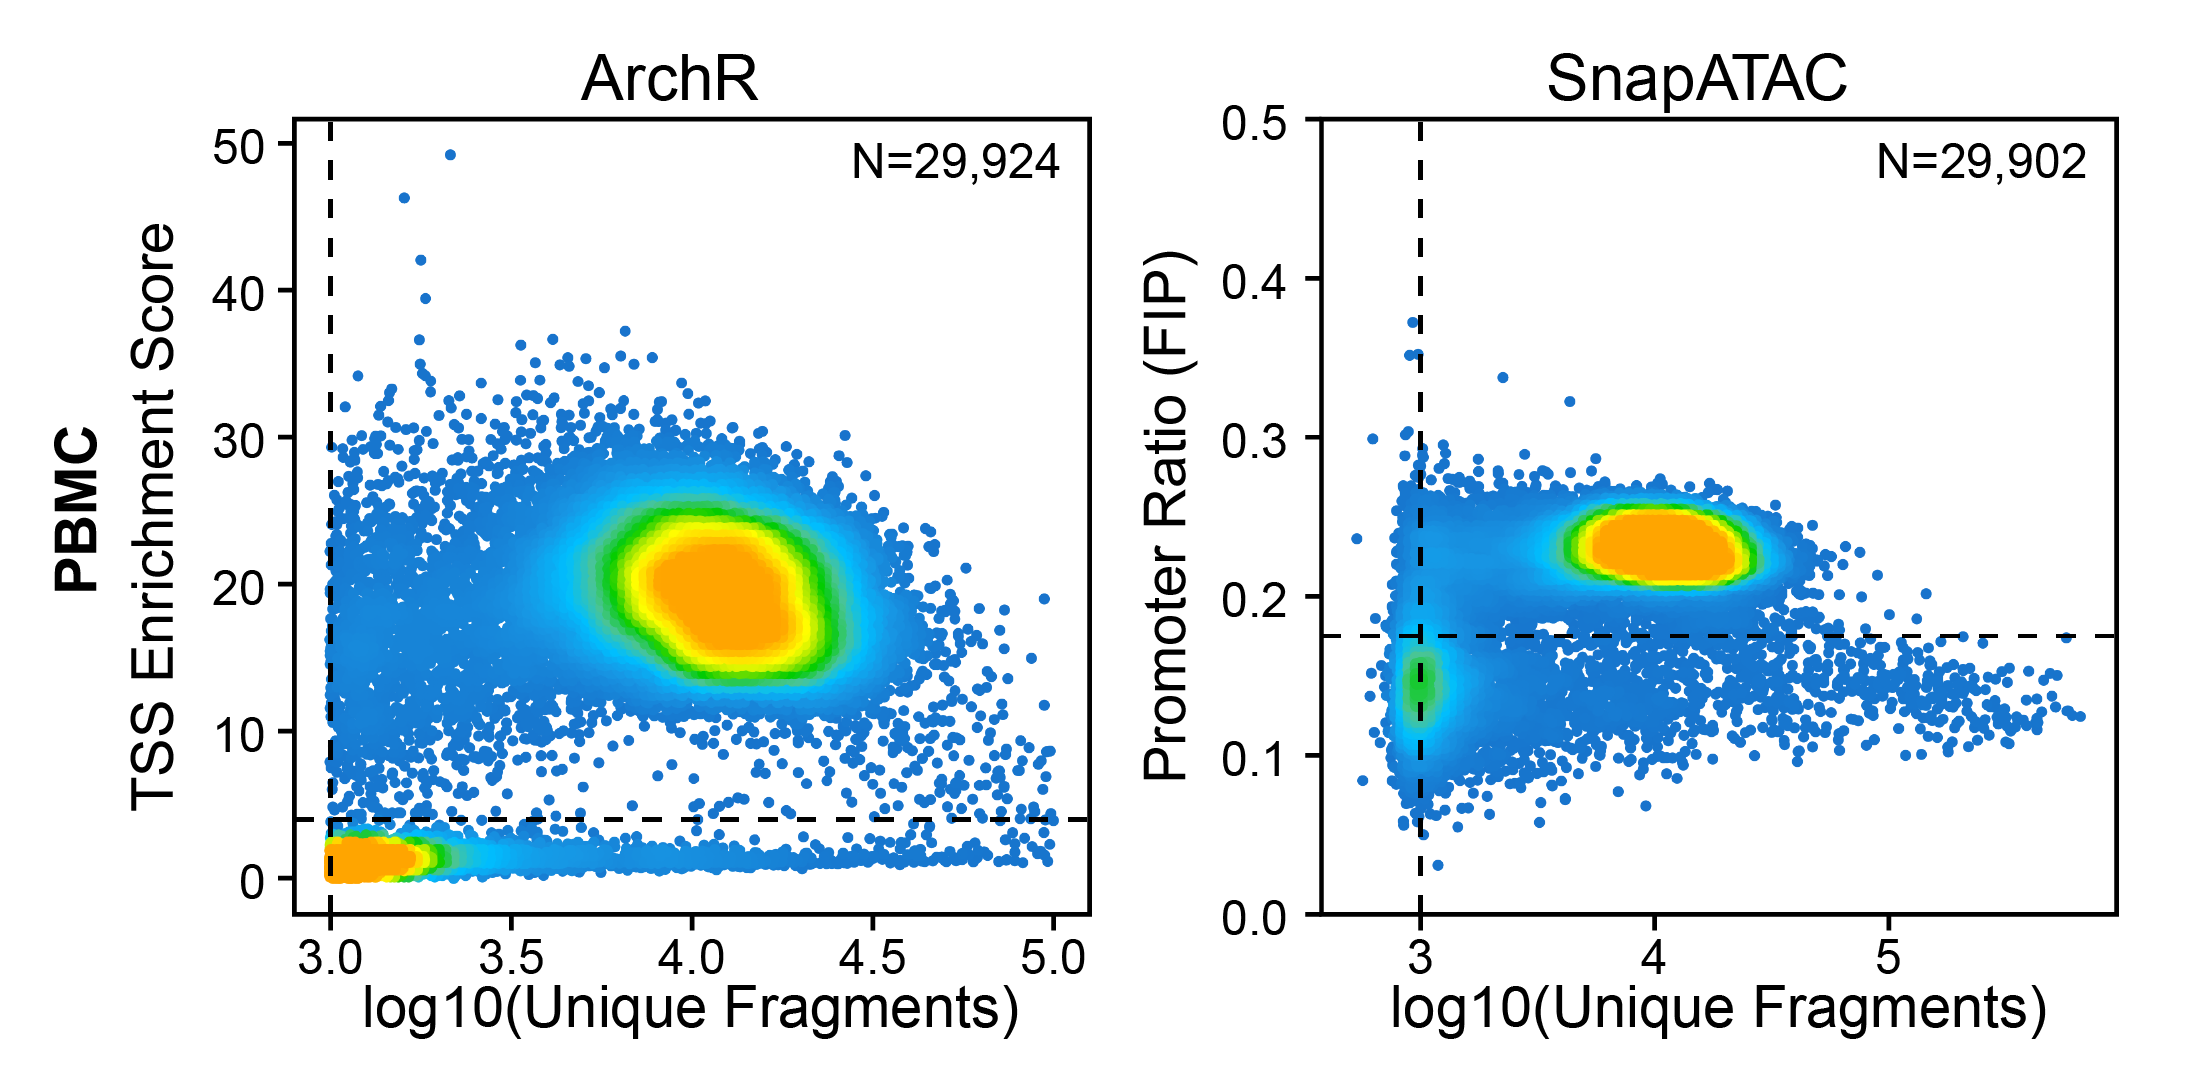
Other quality metrics have been used for ATAC-seq data previously. In particular, the Fraction of Reads in Peaks (aka FRiP) was adopted from ChIP-seq analysis to serve as a signal-to-background measurement. The problem with using FRiP is that you must first define a peak set to use for calculating the fraction of reads within that peak set. This becomes problematic in quality control of single-cell ATAC-seq data because this means that you must define your peak set before clustering because you should filter out low quality cells before clustering. For this reason, FRiP is typically calculated per-cell based on a peak set identified from the merged set of all cells. This obscures cell type-specific peaks from lowly abundant cell types (less than 20%) and thus biases more abundant cell types to having better quality scores. This is certainly not desirable and also underlies the problems associated with using the cells x peaks matrix provided (for ex.) by cellranger which uses peaks called on the merged set of all cells.
To get around this without having to calculate TSS enrichment scores, other tools (SnapATAC v1) have used the Fraction of reads in Promoters (aka FIP) which does not require a pre-defined peak set. However, this metric does not provide as clear a stratification of high-quality cells from low-quality cells.
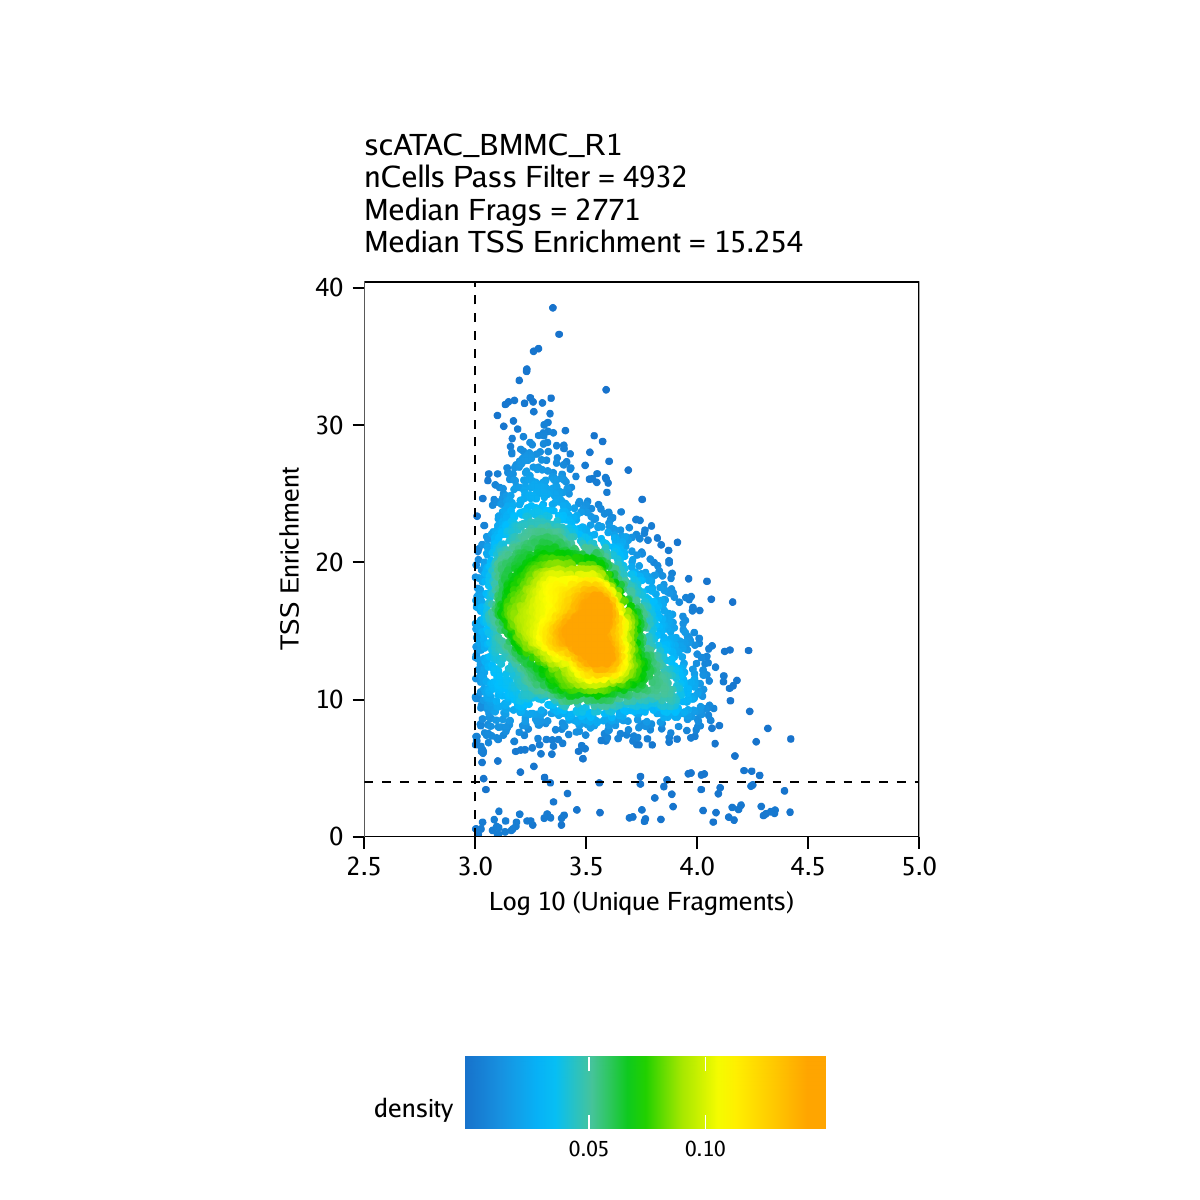
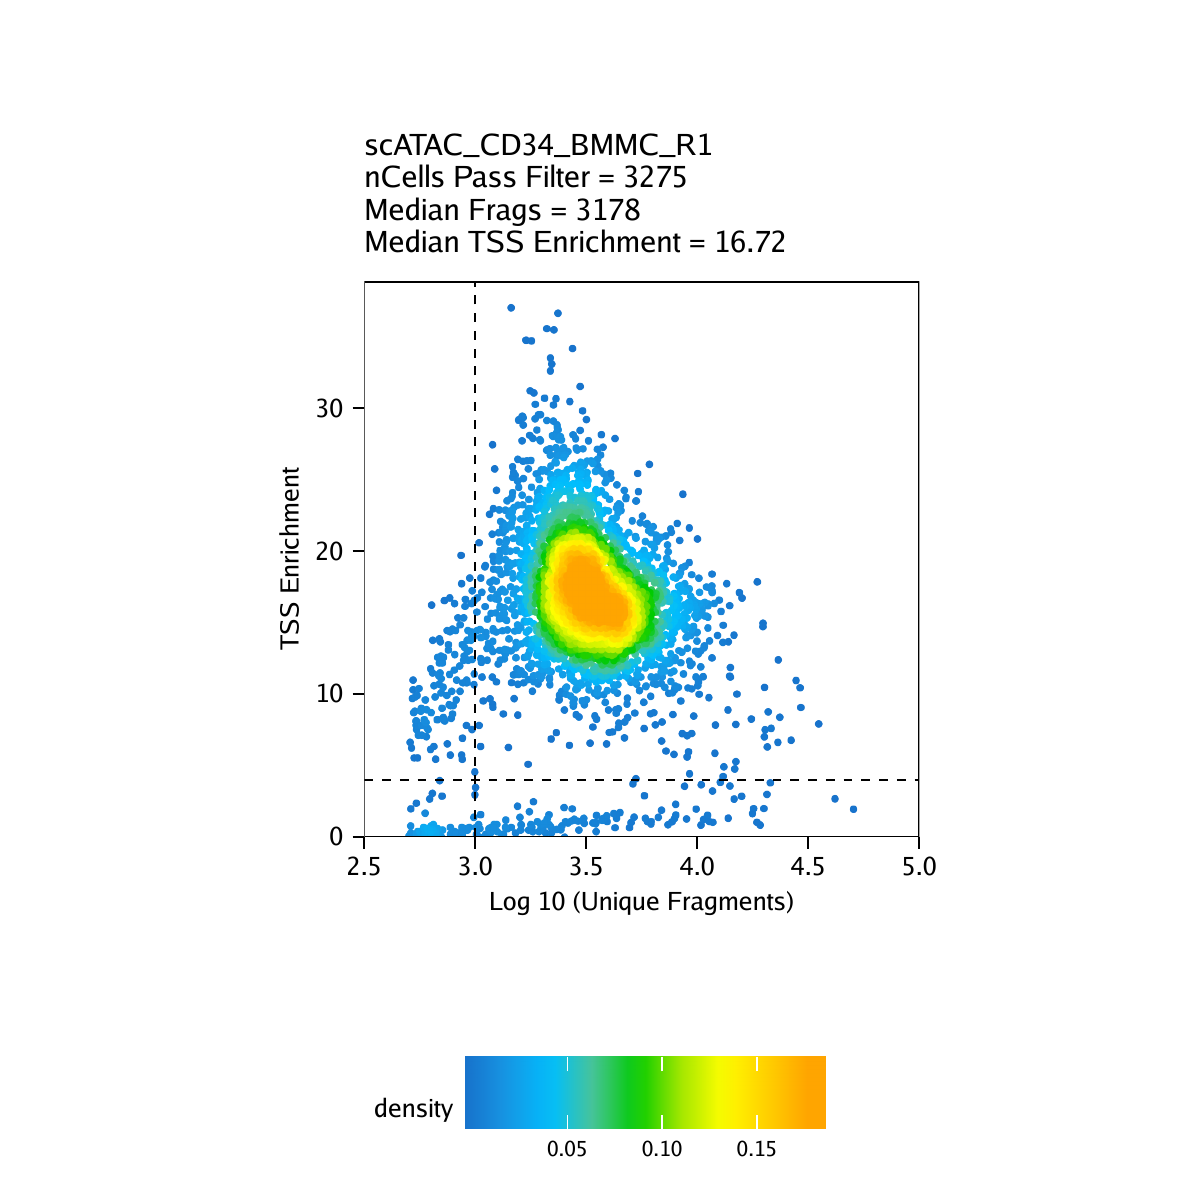
Creation of Arrow files will create a folder in the current working directory called “QualityControl” which will contain 2 plots associated with each of your samples. The first plot shows the log10(unique nuclear fragments) vs TSS enrichment score and indicates the thresholds used with dotted lines. The second shows the fragment size distribution.
For our tutorial data, we have three samples as shown below:
For BMMC:
For CD34 BMMC:
For PBMC:
We are now ready to tidy up these Arrow files and then create an ArchRProject.