9.1 Calculating Gene Scores in ArchR
In our publication, we tested over 50 different gene score models and identified a class of models that consistently outperformed the rest across a variety of test conditions. This class of model, which is implemented as the default in ArchR, has three major components:
- Accessibility within the entire gene body contributes to the gene score.
- An exponential weighting function that accounts for the activity of putative distal regulatory elements in a distance-dependent fashion.
- Imposed gene boundaries that minimizes the contribution of unrelated regulatory elements to the gene score.
So how does ArchR calculate gene scores? For each chromosome, ArchR creates a tile matrix using a user-defined tile size that is not pre-computed (default is 500 bp), overlaps these tiles with the user-defined gene window (default is 100 kb on either side of the gene), and then computes the distance from each tile (start or end) to the gene body (with optional extensions upstream or downstream) or gene start. We have found that the best predictor of gene expression is the local accessibility of the gene region which includes the promoter and gene body. As mentioned above, to properly account for distal accessibility for a given gene, ArchR identifies the subset of tiles that are within the gene window and do not cross another gene region. This filtering allows for inclusion of distal regulatory elements that could improve the accuracy of predicting gene expression values but excludes regulatory elements more likely to be associated with another gene (for ex. the promoter of a nearby gene). The distance from each tile to the gene is then converted to a distance weight using a user-defined accessibility model (default is e(-abs(distance)/5000) + e-1). When the gene body is included in the gene region (where the distance-based weight is the maximum weight possible), we found that extremely large genes can bias the overall gene scores. In these cases, the total gene scores can vary substantially due to the inclusion of insertions in both introns and exons. To help adjust for these large differences in gene size, ArchR applies a separate weight for the inverse of the gene size (1 / gene size) and scales this inverse weight linearly from 1 to a user-defined hard maximum (default of 5). Smaller genes thus receive larger relative weights, partially normalizing this length effect. The corresponding distance and gene size weights are then multiplied by the number of Tn5 insertions within each tile and summed across all tiles within the gene window, while still accounting for nearby gene regions as described above. This summed accessibility is a “gene score” and is depth normalized across all genes to a user-defined constant (default of 10,000). Computed gene scores are then stored in the corresponding Arrow file for downstream analyses.
To illustrate what the default ArchR gene score model looks like, we provide this toy example showing the weighting applied across the entire gene region:
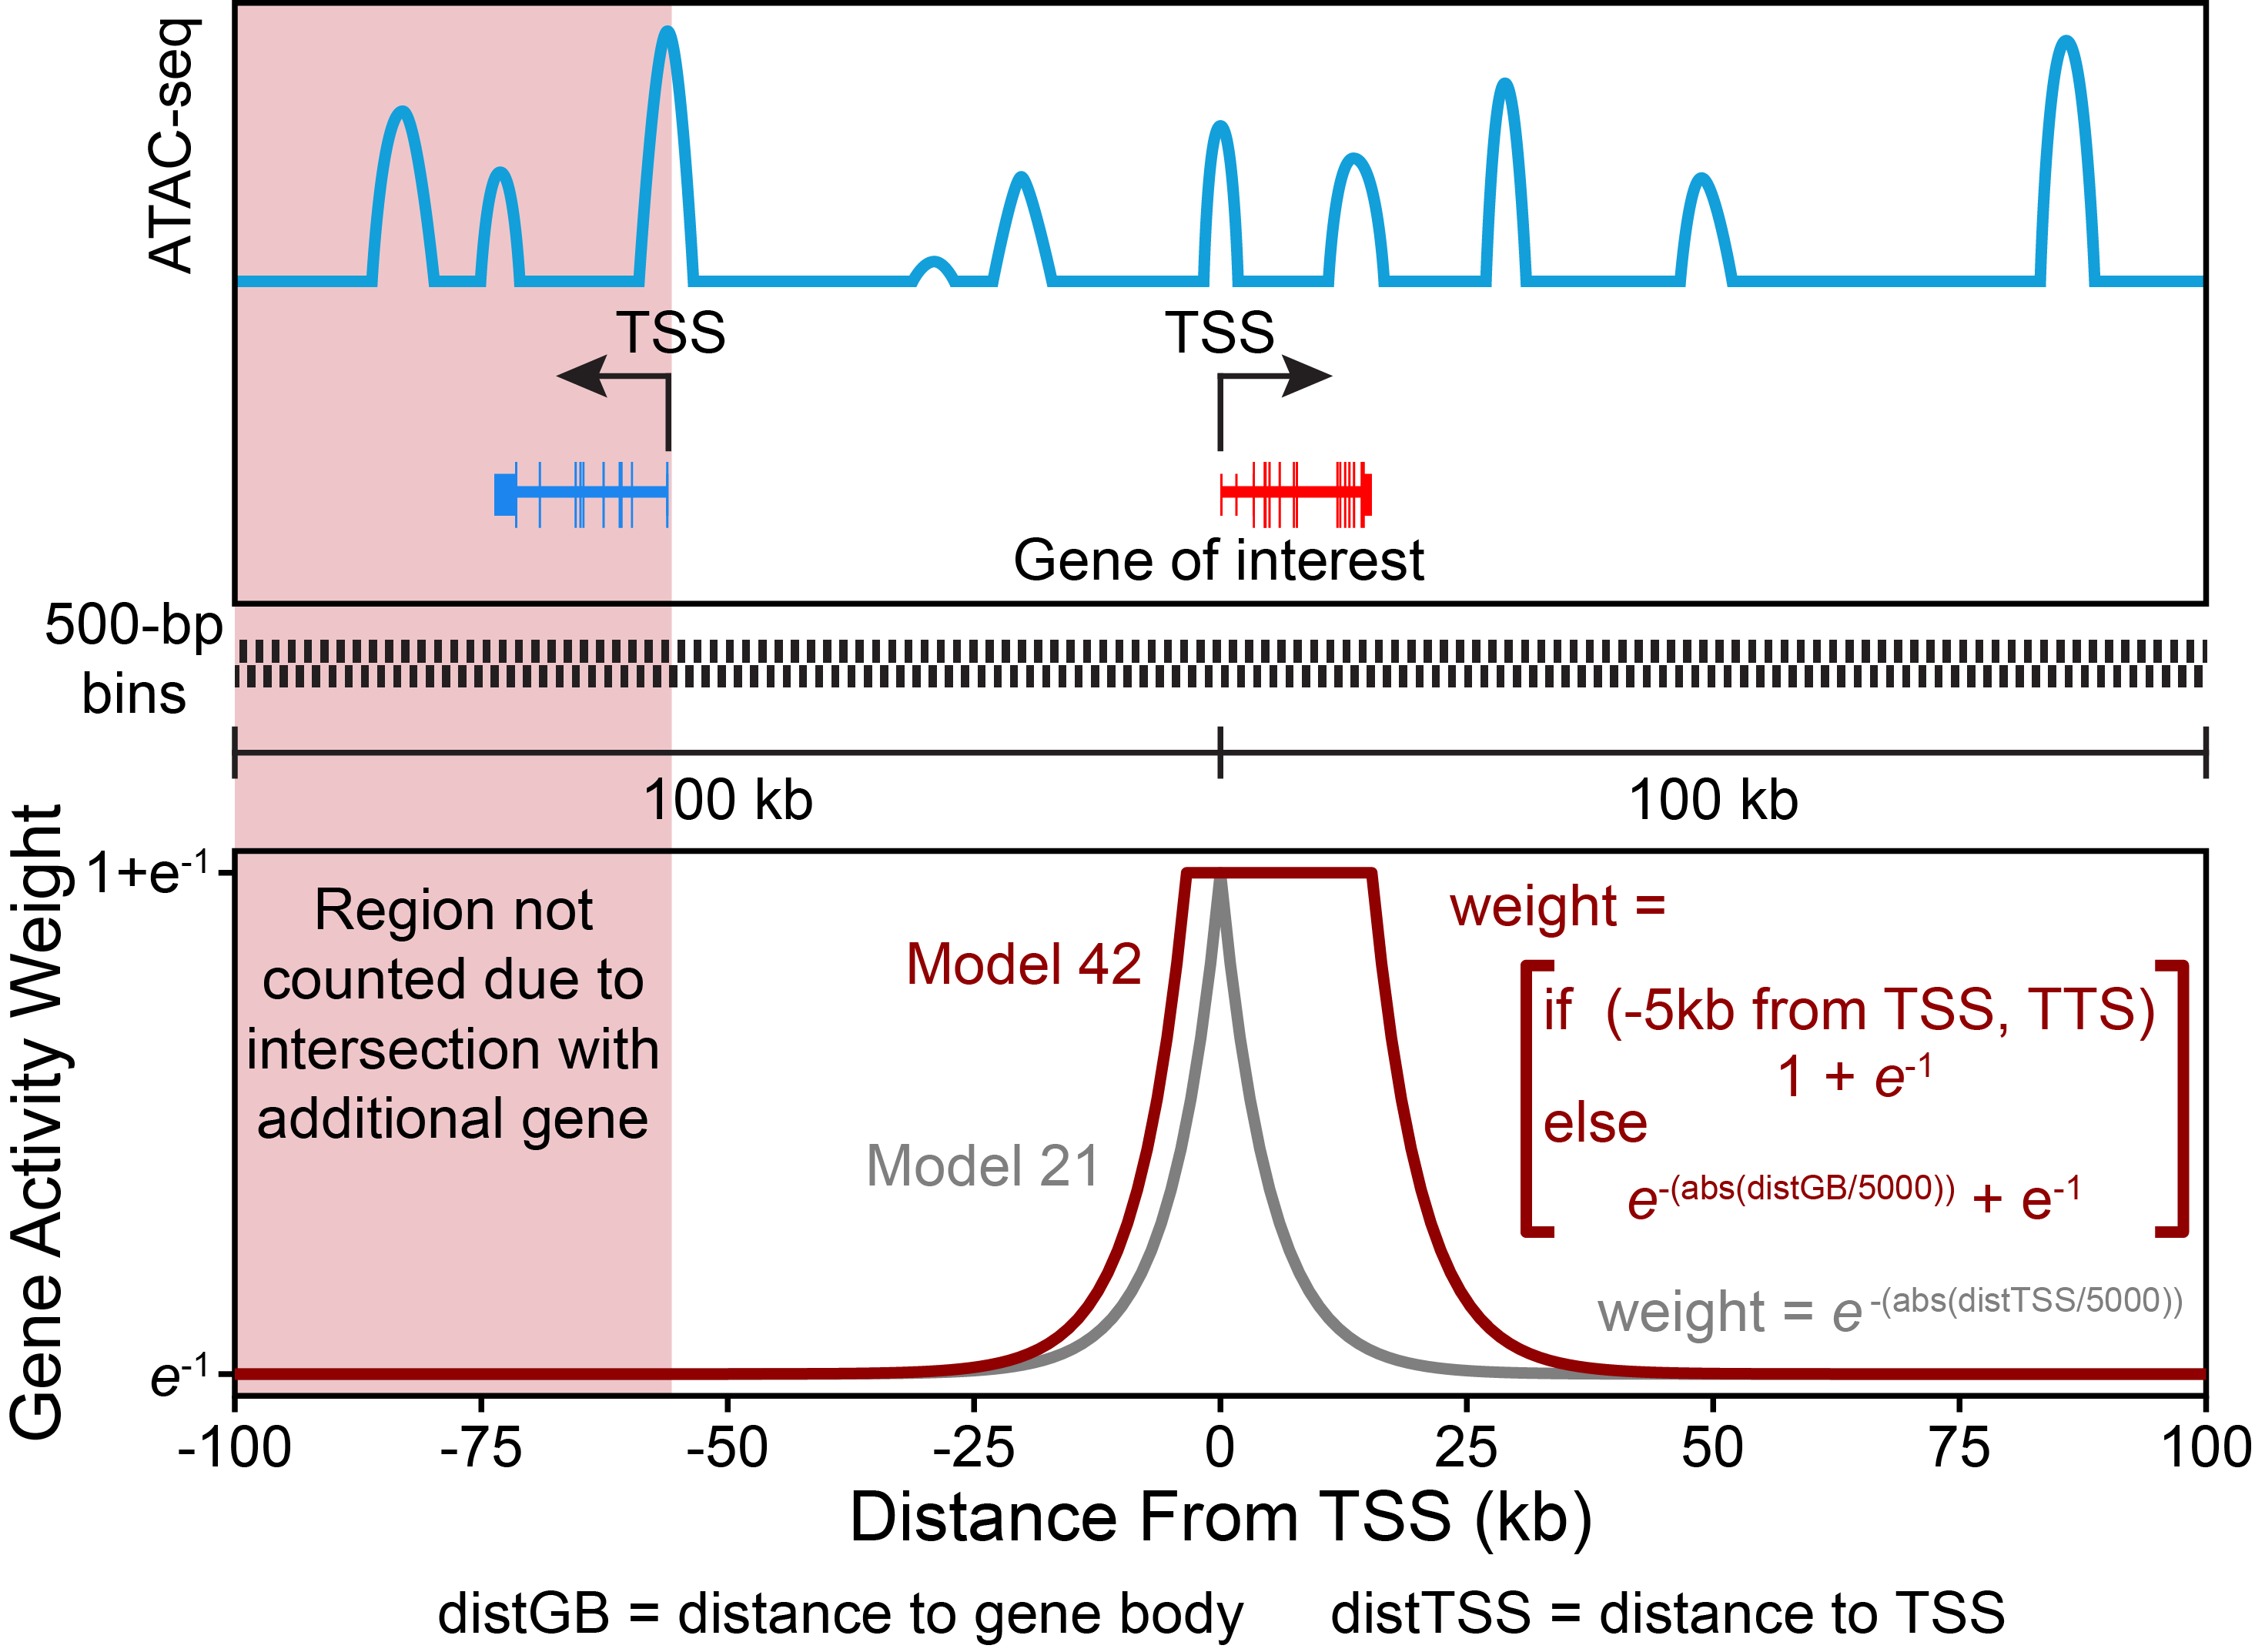
Gene scores are calculated for each Arrow file at the time of creation if the parameter addGeneScoreMat is set to TRUE - this is the default behavior. If you wish to change any of the default parameters for gene score calculation during Arrow file creation, you can use the GeneScoreMatParams parameter. By default, gene scores are depth normalized based on the scaleTo parameter. If you do not wish to add gene scores to your Arrow file at the time of creation, gene scores can be added to Arrow files at any time by using the addGeneScoreMatrix() function. Gene scores are stored in a matrix within each Arrow file called “GeneScoreMatrix”. Once caluclated, gene scores can be used for many different analyses. For example, individual cells of an embedding can be colored by their gene scores to help with the identification of various cell types. We illustrate the application of gene scores throughout the rest of this chapter.
It is important to note that not all genes behave well with gene scores. In particular, genes that reside in very gene-dense areas can be problematic. Thus, it is always best to sanity check all gene score analyses by looking at sequencing tracks which is described in a later chapter.