4.2 Inferring scATAC-seq Doublets with ArchR
By default ArchR uses the doublet parameters described in the ArchR manuscript. This is likely a good place to start but we encourage all users to inspect the pre- and post-doublet removal data to understand how doublet removal is affecting the cells. We show some of the main adjustable features below to illustrate how this can be customized to a given application.
In ArchR, doublet removal is performed in a single step using addDoubletScores(). This adds the infered doublet scores to each Arrow file and will take approximately 2-5 minutes per sample of the tutorial data. You can always try ?addDoubletScores to see further documentation on parameters for doublet identification (or any ArchR function for that matter).
doubScores <- addDoubletScores(
    input = ArrowFiles,
    k = 10, #Refers to how many cells near a "pseudo-doublet" to count.
    knnMethod = "UMAP", #Refers to the embedding to use for nearest neighbor search with doublet projection.
    LSIMethod = 1
)
## ArchR logging to : ArchRLogs/ArchR-addDoubletScores-974b4c906-Date-2025-02-06_Time-00-44-32.639996.log
## If there is an issue, please report to github with logFile!
## 2025-02-06 00:44:32.966947 : Batch Execution w/ safelapply!, 0 mins elapsed.
## 2025-02-06 00:44:32.984376 : scATAC_BMMC_R1 (1 of 3) :  Computing Doublet Statistics, 0 mins elapsed.
## scATAC_BMMC_R1 (1 of 3) : UMAP Projection R^2 = 0.98913
## scATAC_BMMC_R1 (1 of 3) : UMAP Projection R^2 = 0.98913
## 2025-02-06 00:46:06.974304 : scATAC_CD34_BMMC_R1 (2 of 3) :  Computing Doublet Statistics, 1.567 mins elapsed.
## scATAC_CD34_BMMC_R1 (2 of 3) : UMAP Projection R^2 = 0.99312
## scATAC_CD34_BMMC_R1 (2 of 3) : UMAP Projection R^2 = 0.99312
## 2025-02-06 00:47:22.417418 : scATAC_PBMC_R1 (3 of 3) :  Computing Doublet Statistics, 2.824 mins elapsed.
## scATAC_PBMC_R1 (3 of 3) : UMAP Projection R^2 = 0.99346
## scATAC_PBMC_R1 (3 of 3) : UMAP Projection R^2 = 0.99346
## ArchR logging successful to : ArchRLogs/ArchR-addDoubletScores-974b4c906-Date-2025-02-06_Time-00-44-32.639996.log
In the above output, ArchR reports the R2 value for the UMAP projection for each Arrow file. If these R2 values are much lower (i.e. less than 0.9), this often indicates that the cells within the Arrow file have very little heterogeneity. This makes the accuracy of doublet calling worse because the majority of doublets would be “homotypic” - or a single droplet with two very similar cells. In these cases, ArchR will skip doublet prediction because it is not accurate. Alternatively, you can try setting knnMethod = "LSI" and force = TRUE to perform projection in the LSI subspace; however, you should manually assess the results and make sure this is performing as you would expect.
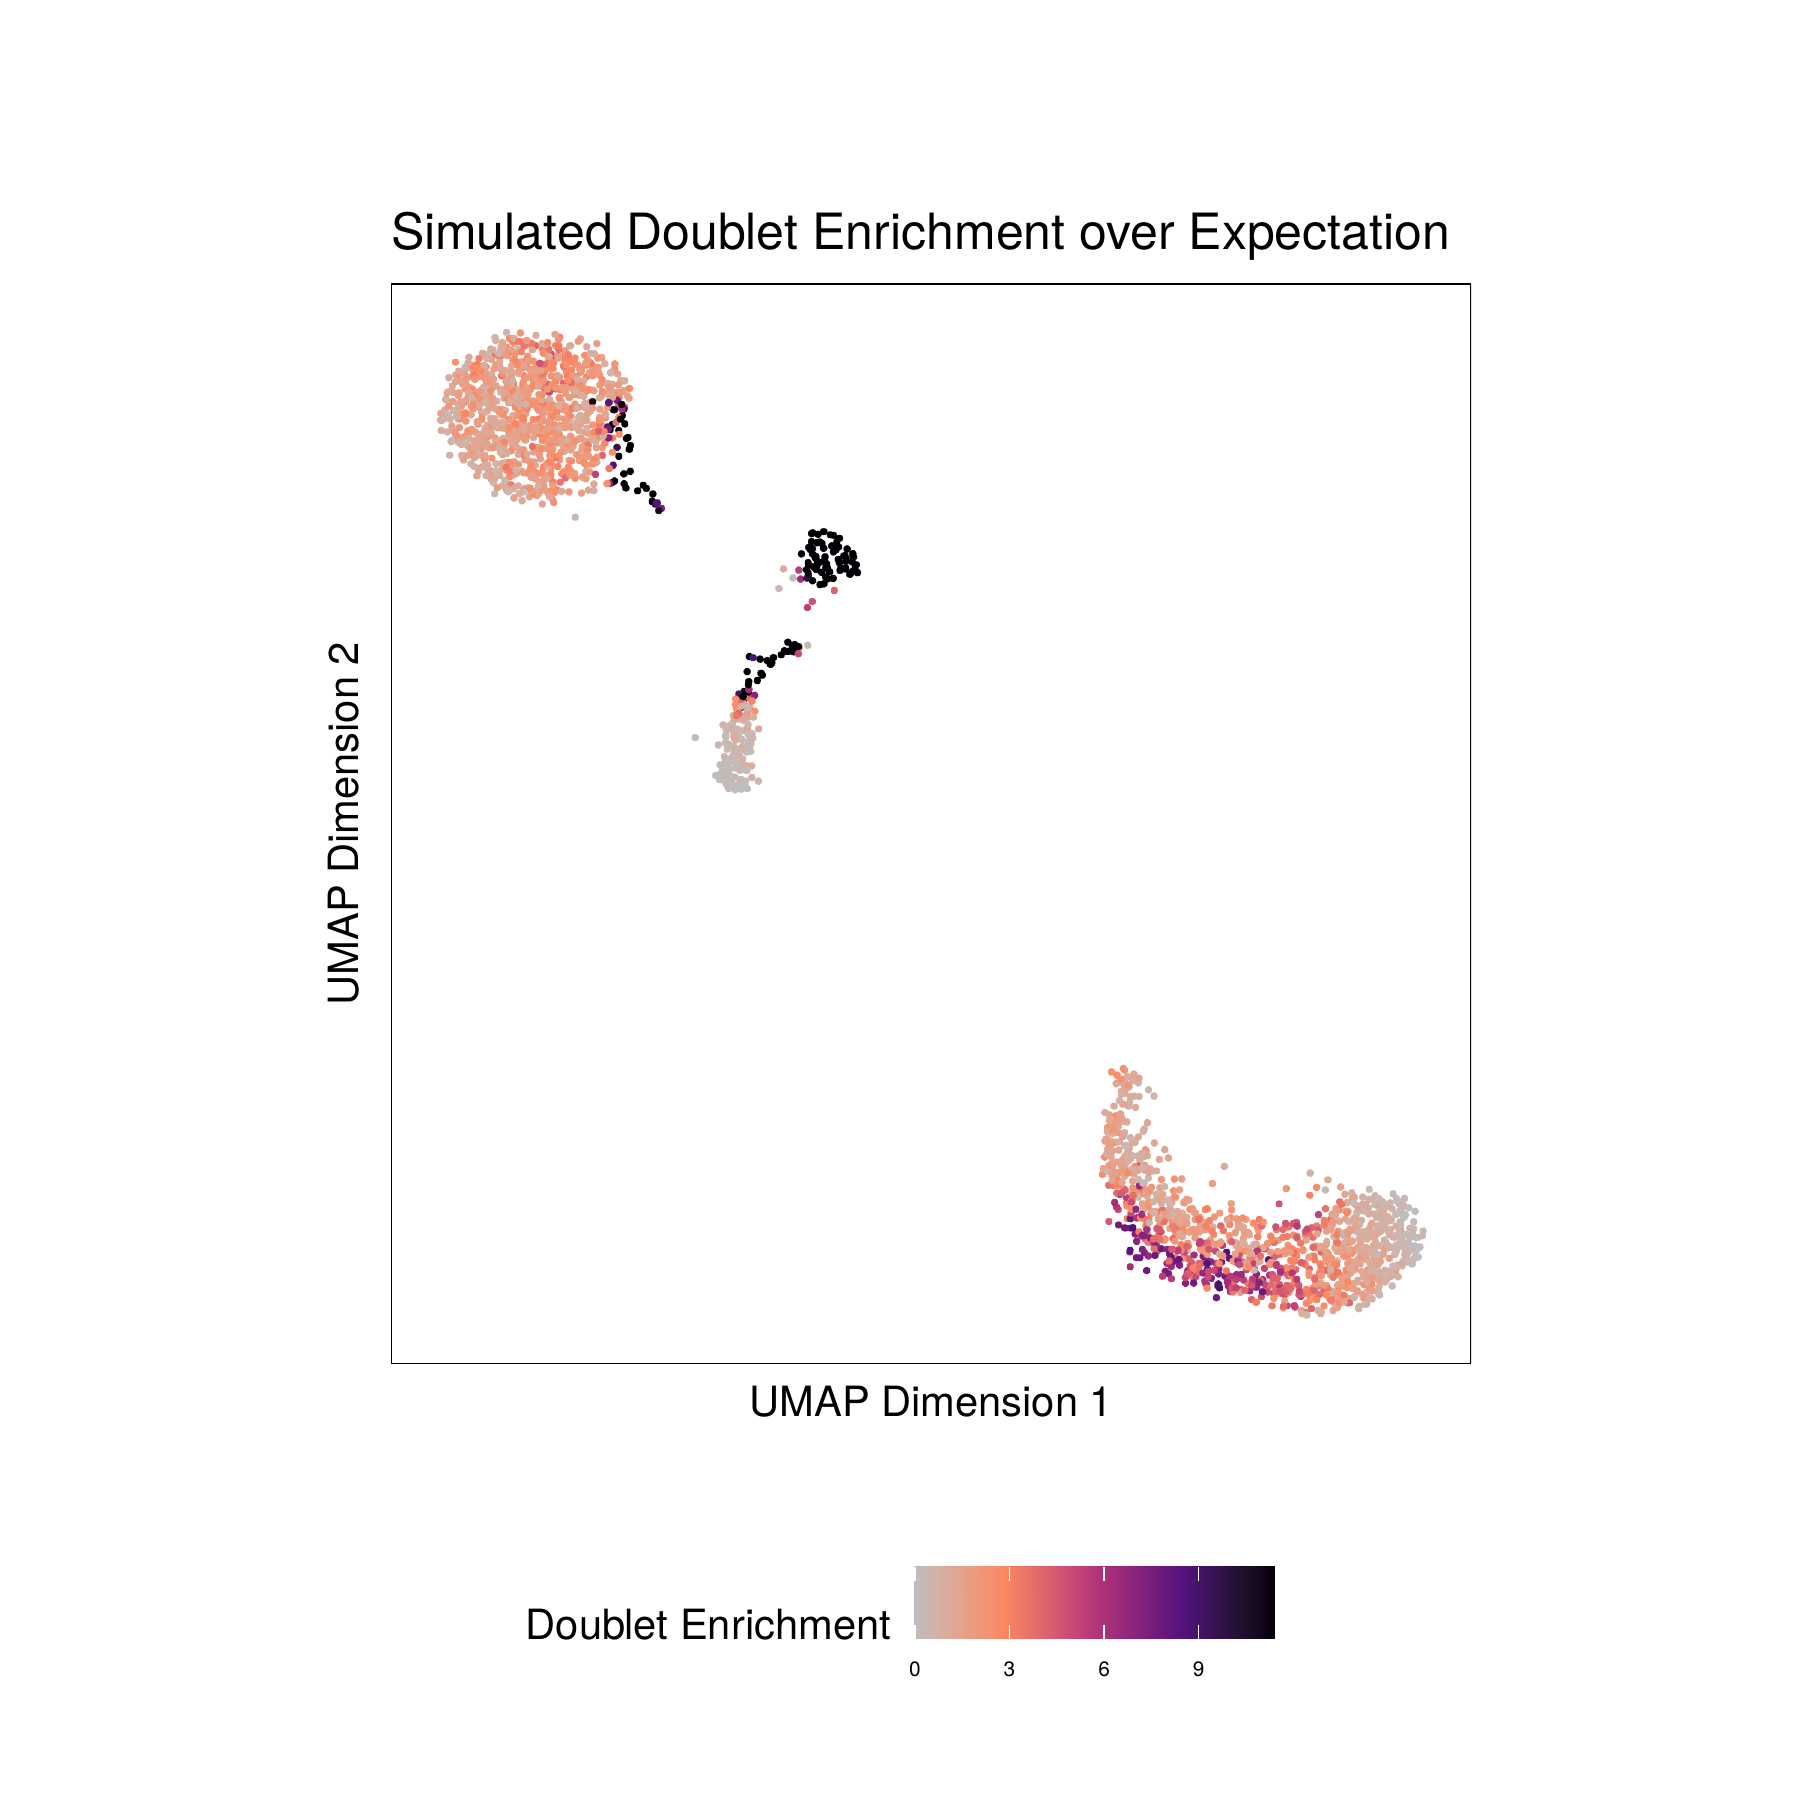
Adding doublet scores will create plots in the “QualityControl” directory. There are 3 plots associated with each of your samples in this folder:
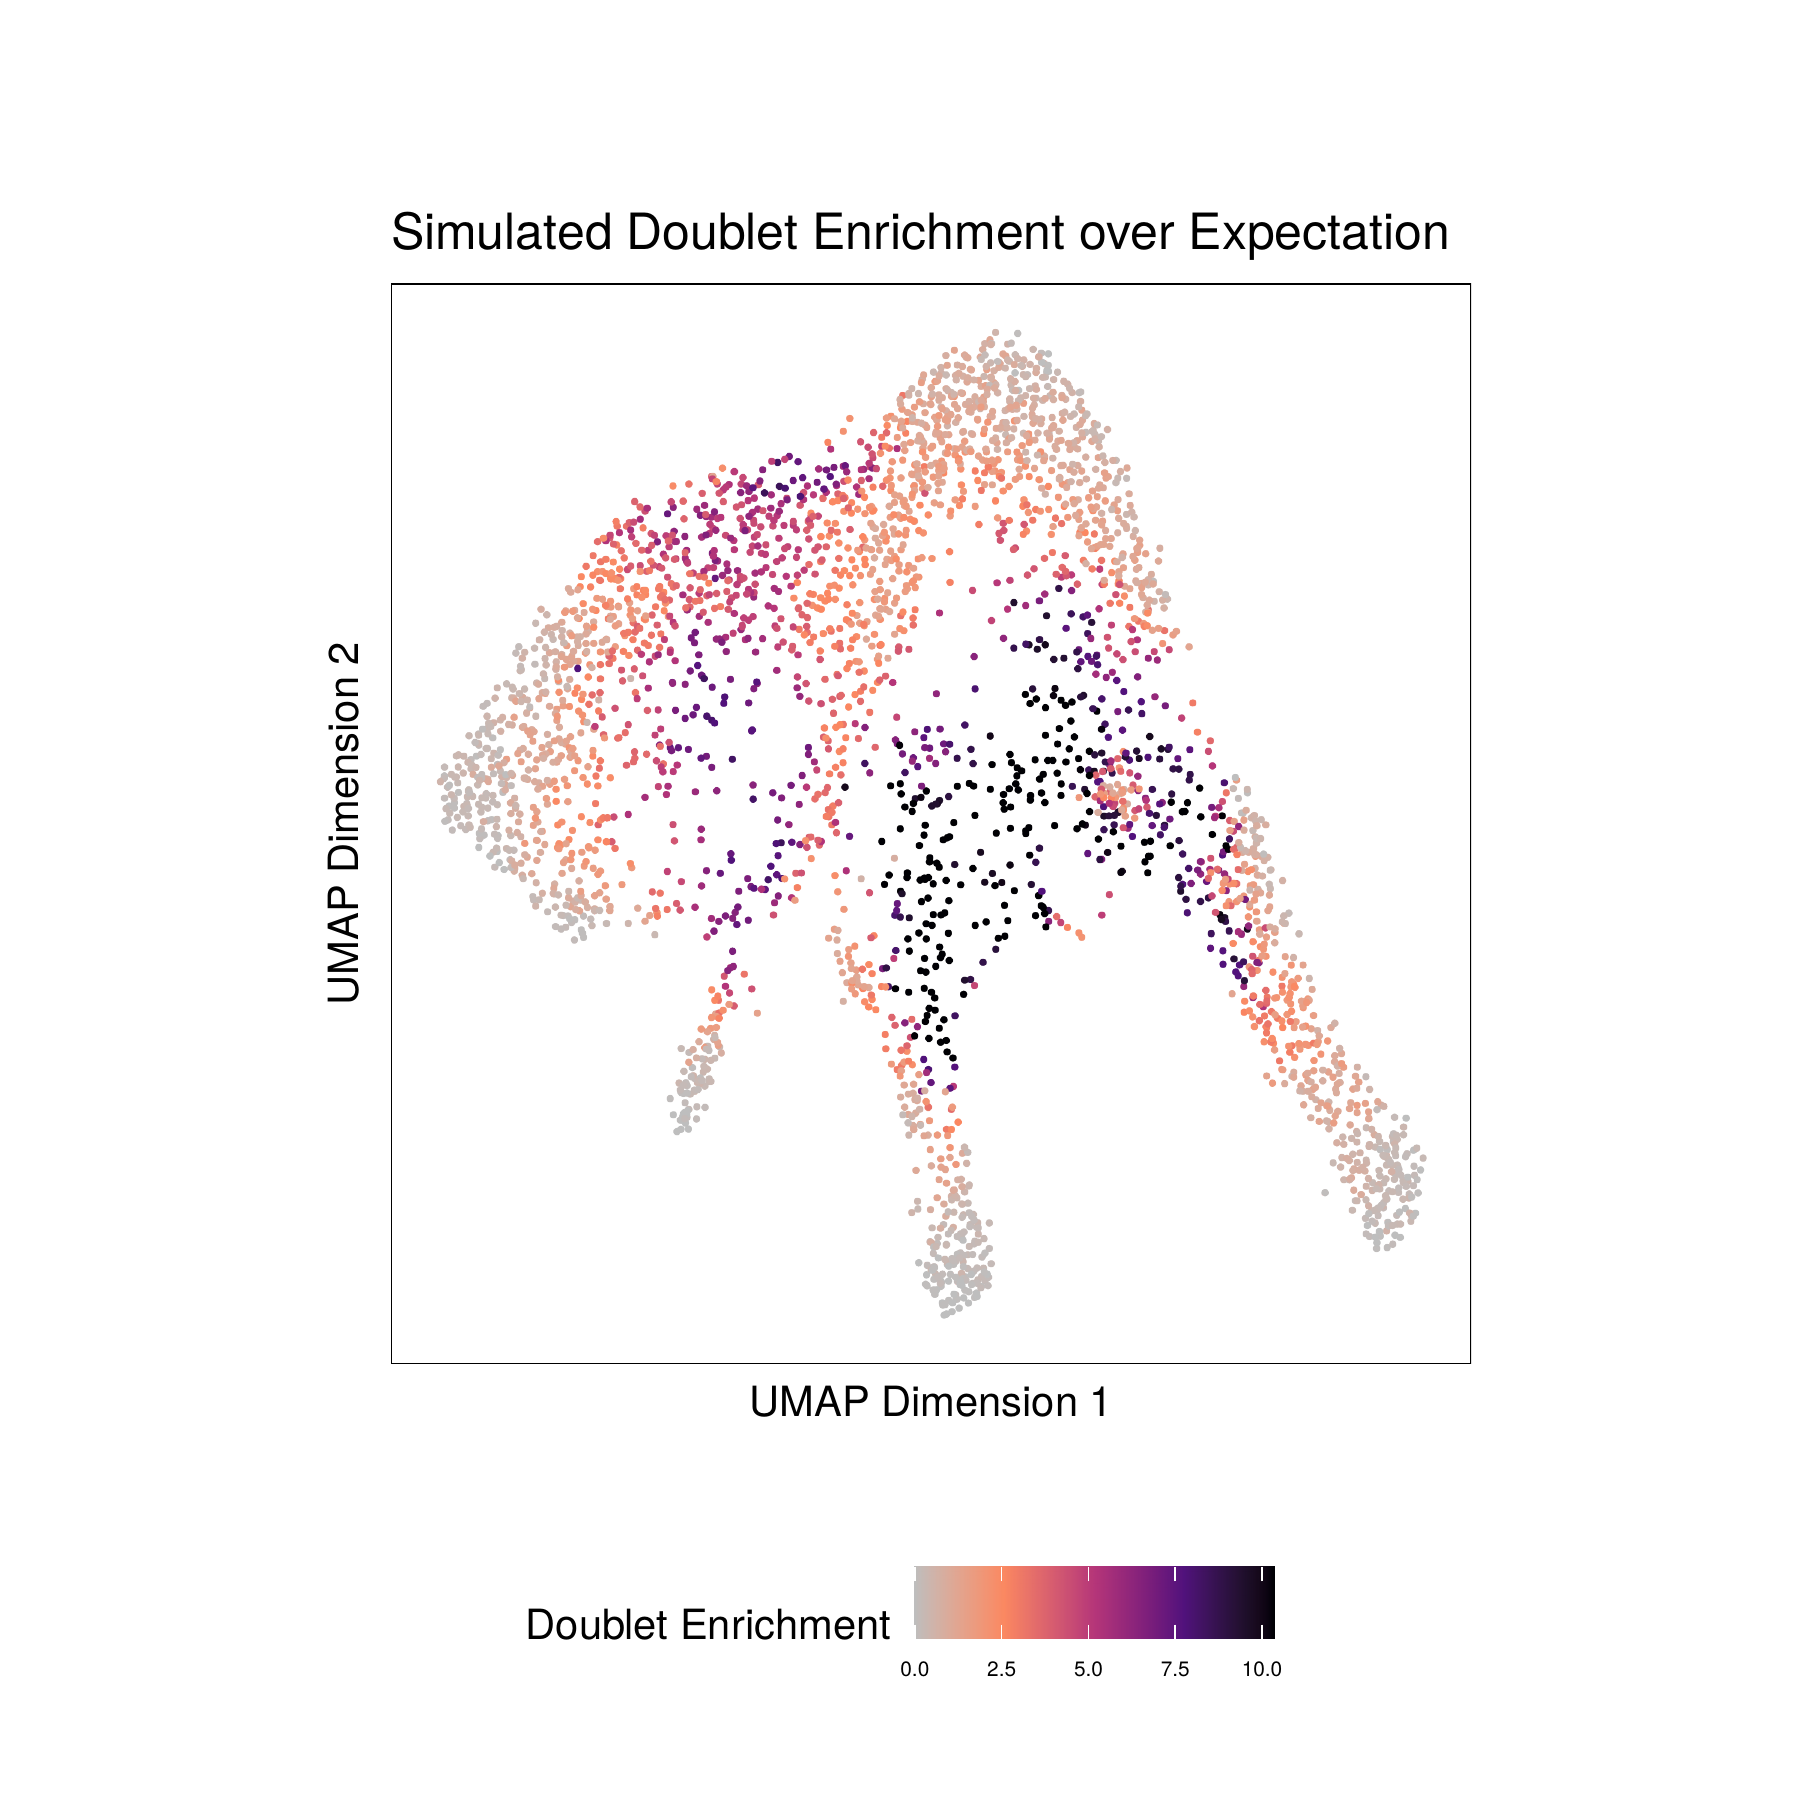
- Doublet Enrichments - These represent the enrichment of simulated doublets nearby each single cell compared to the expected if we assume a uniform distribution.
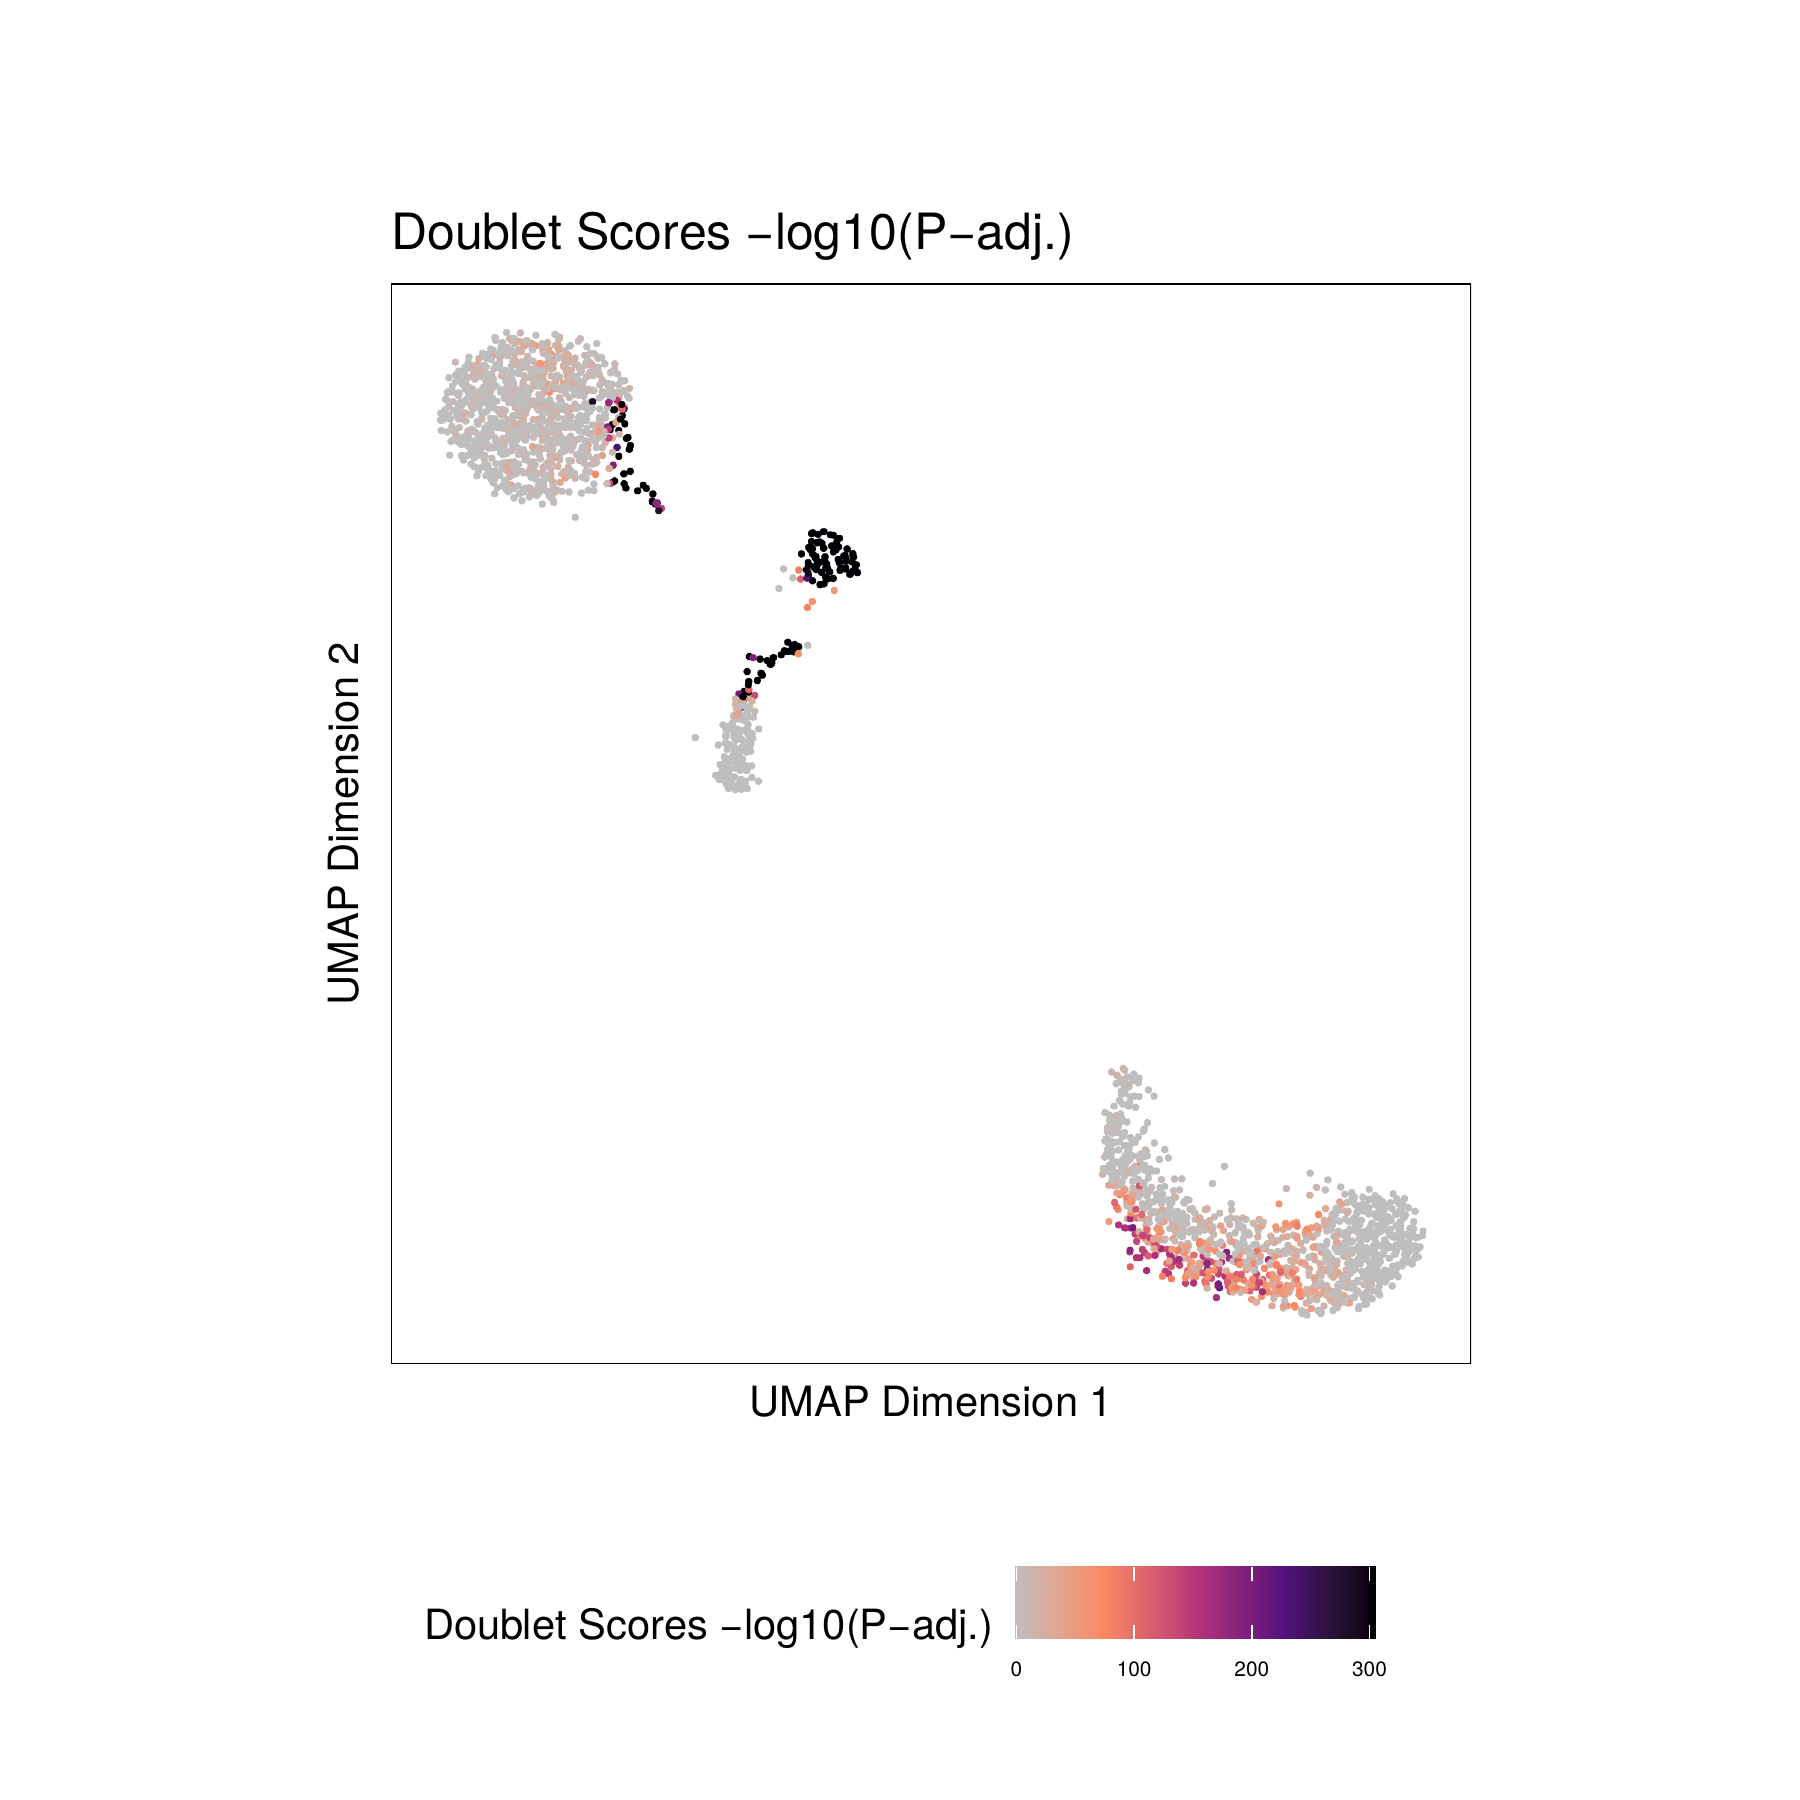
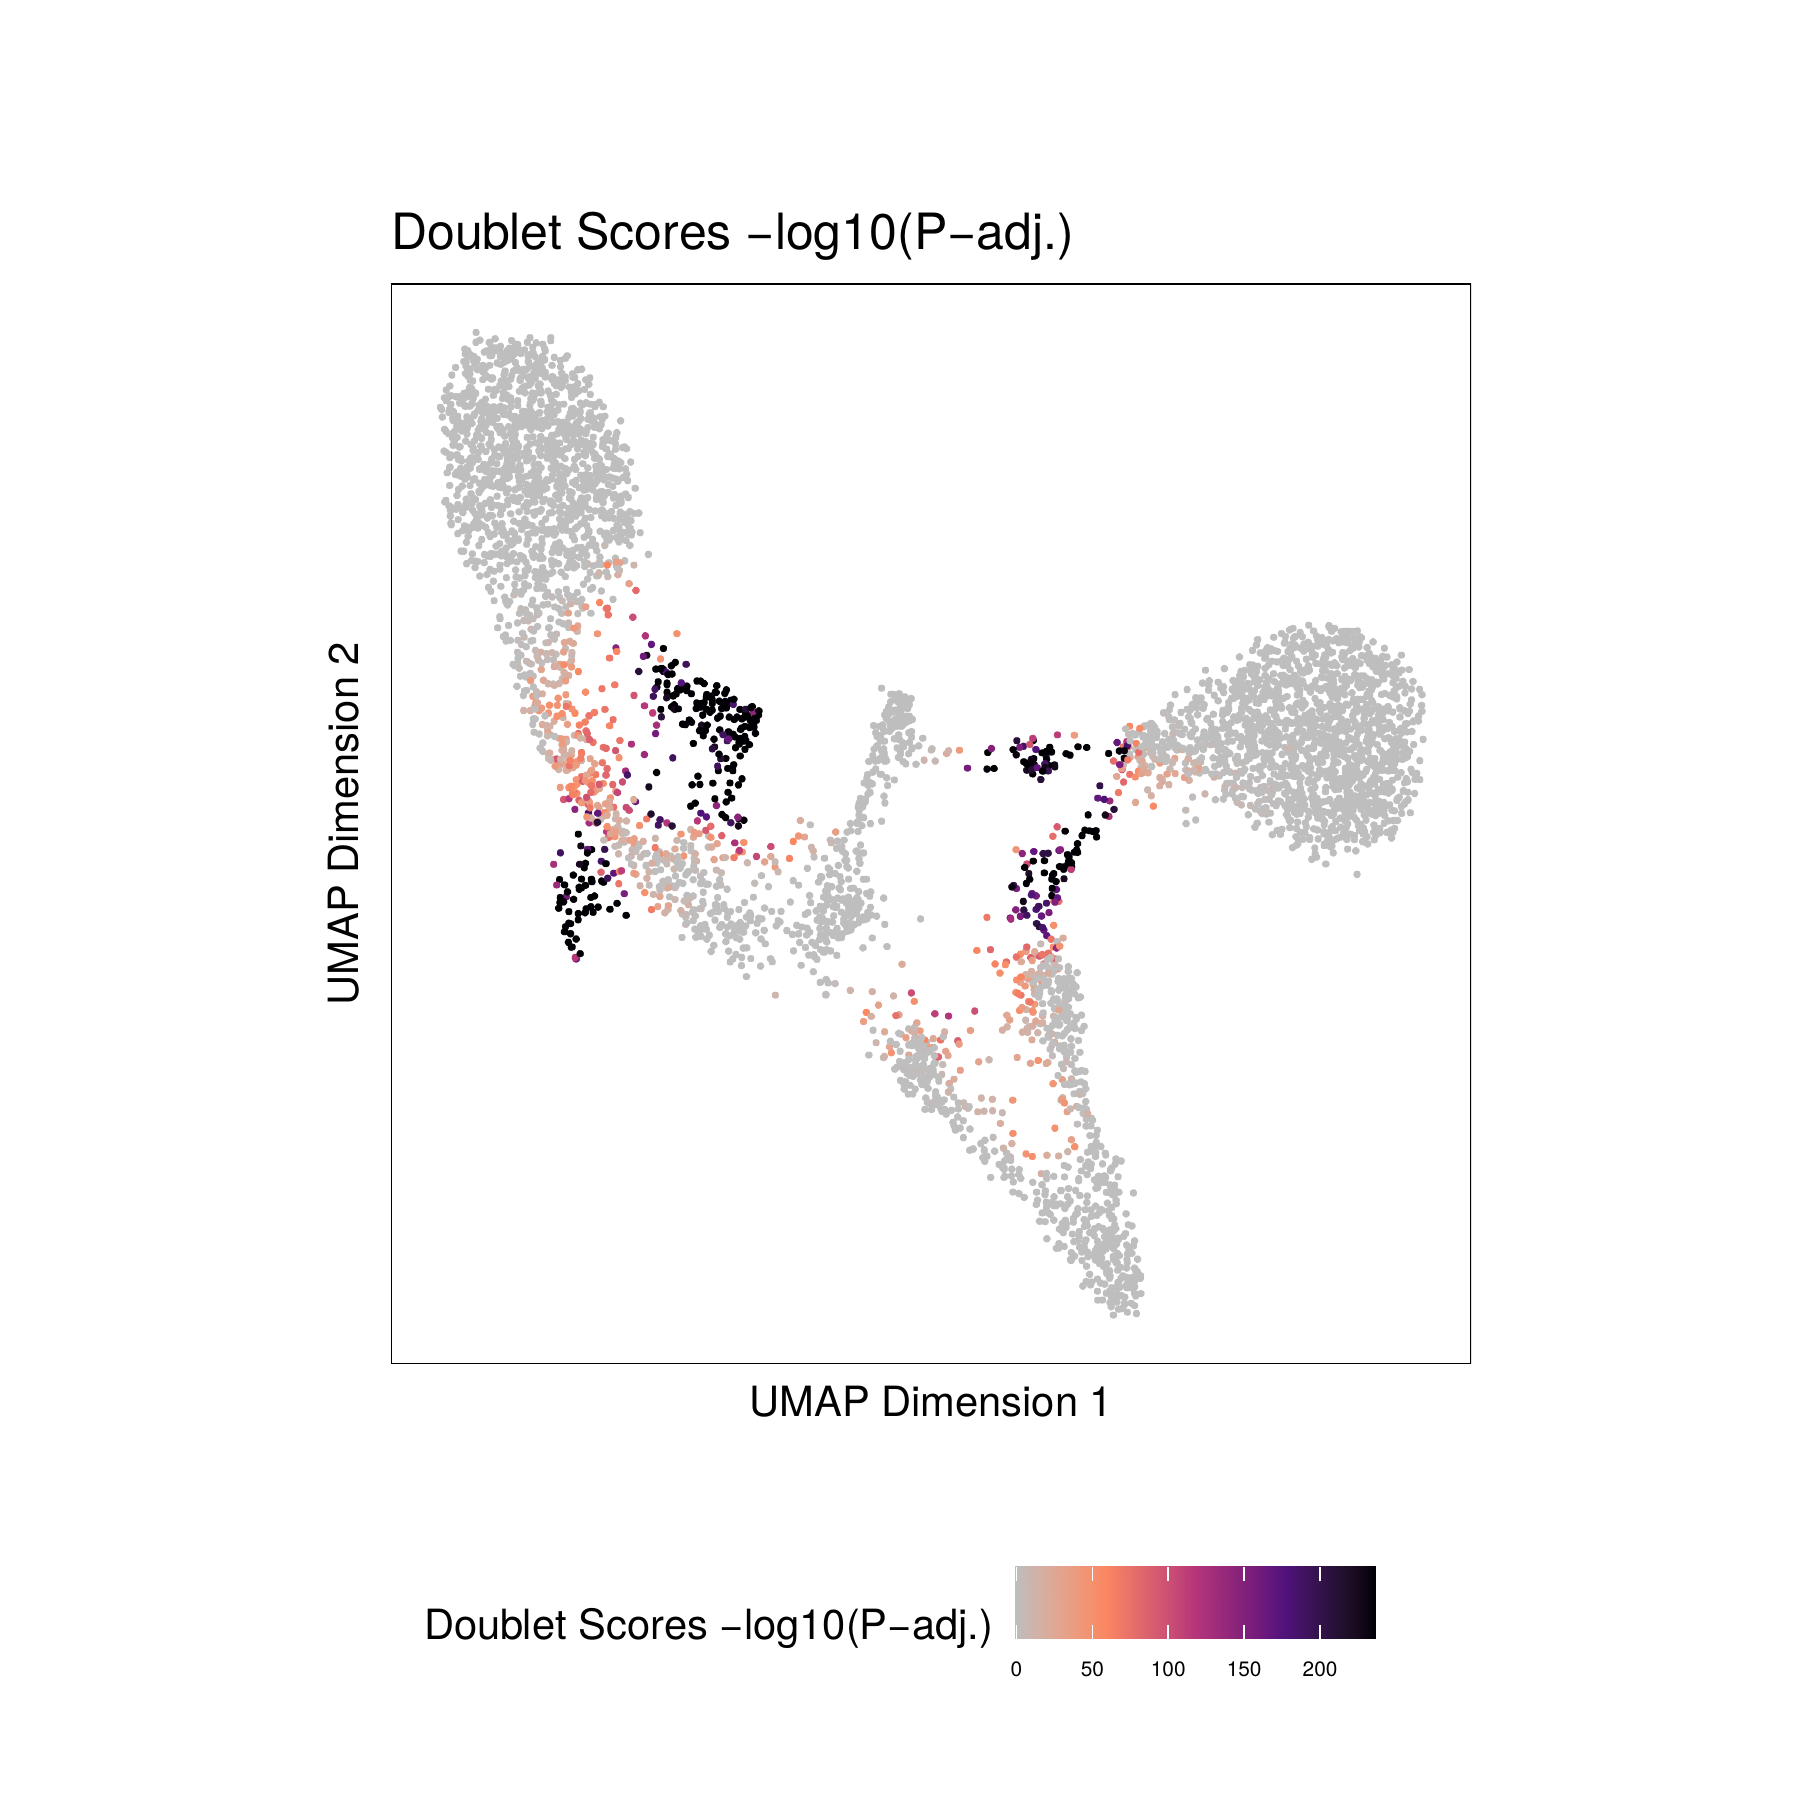
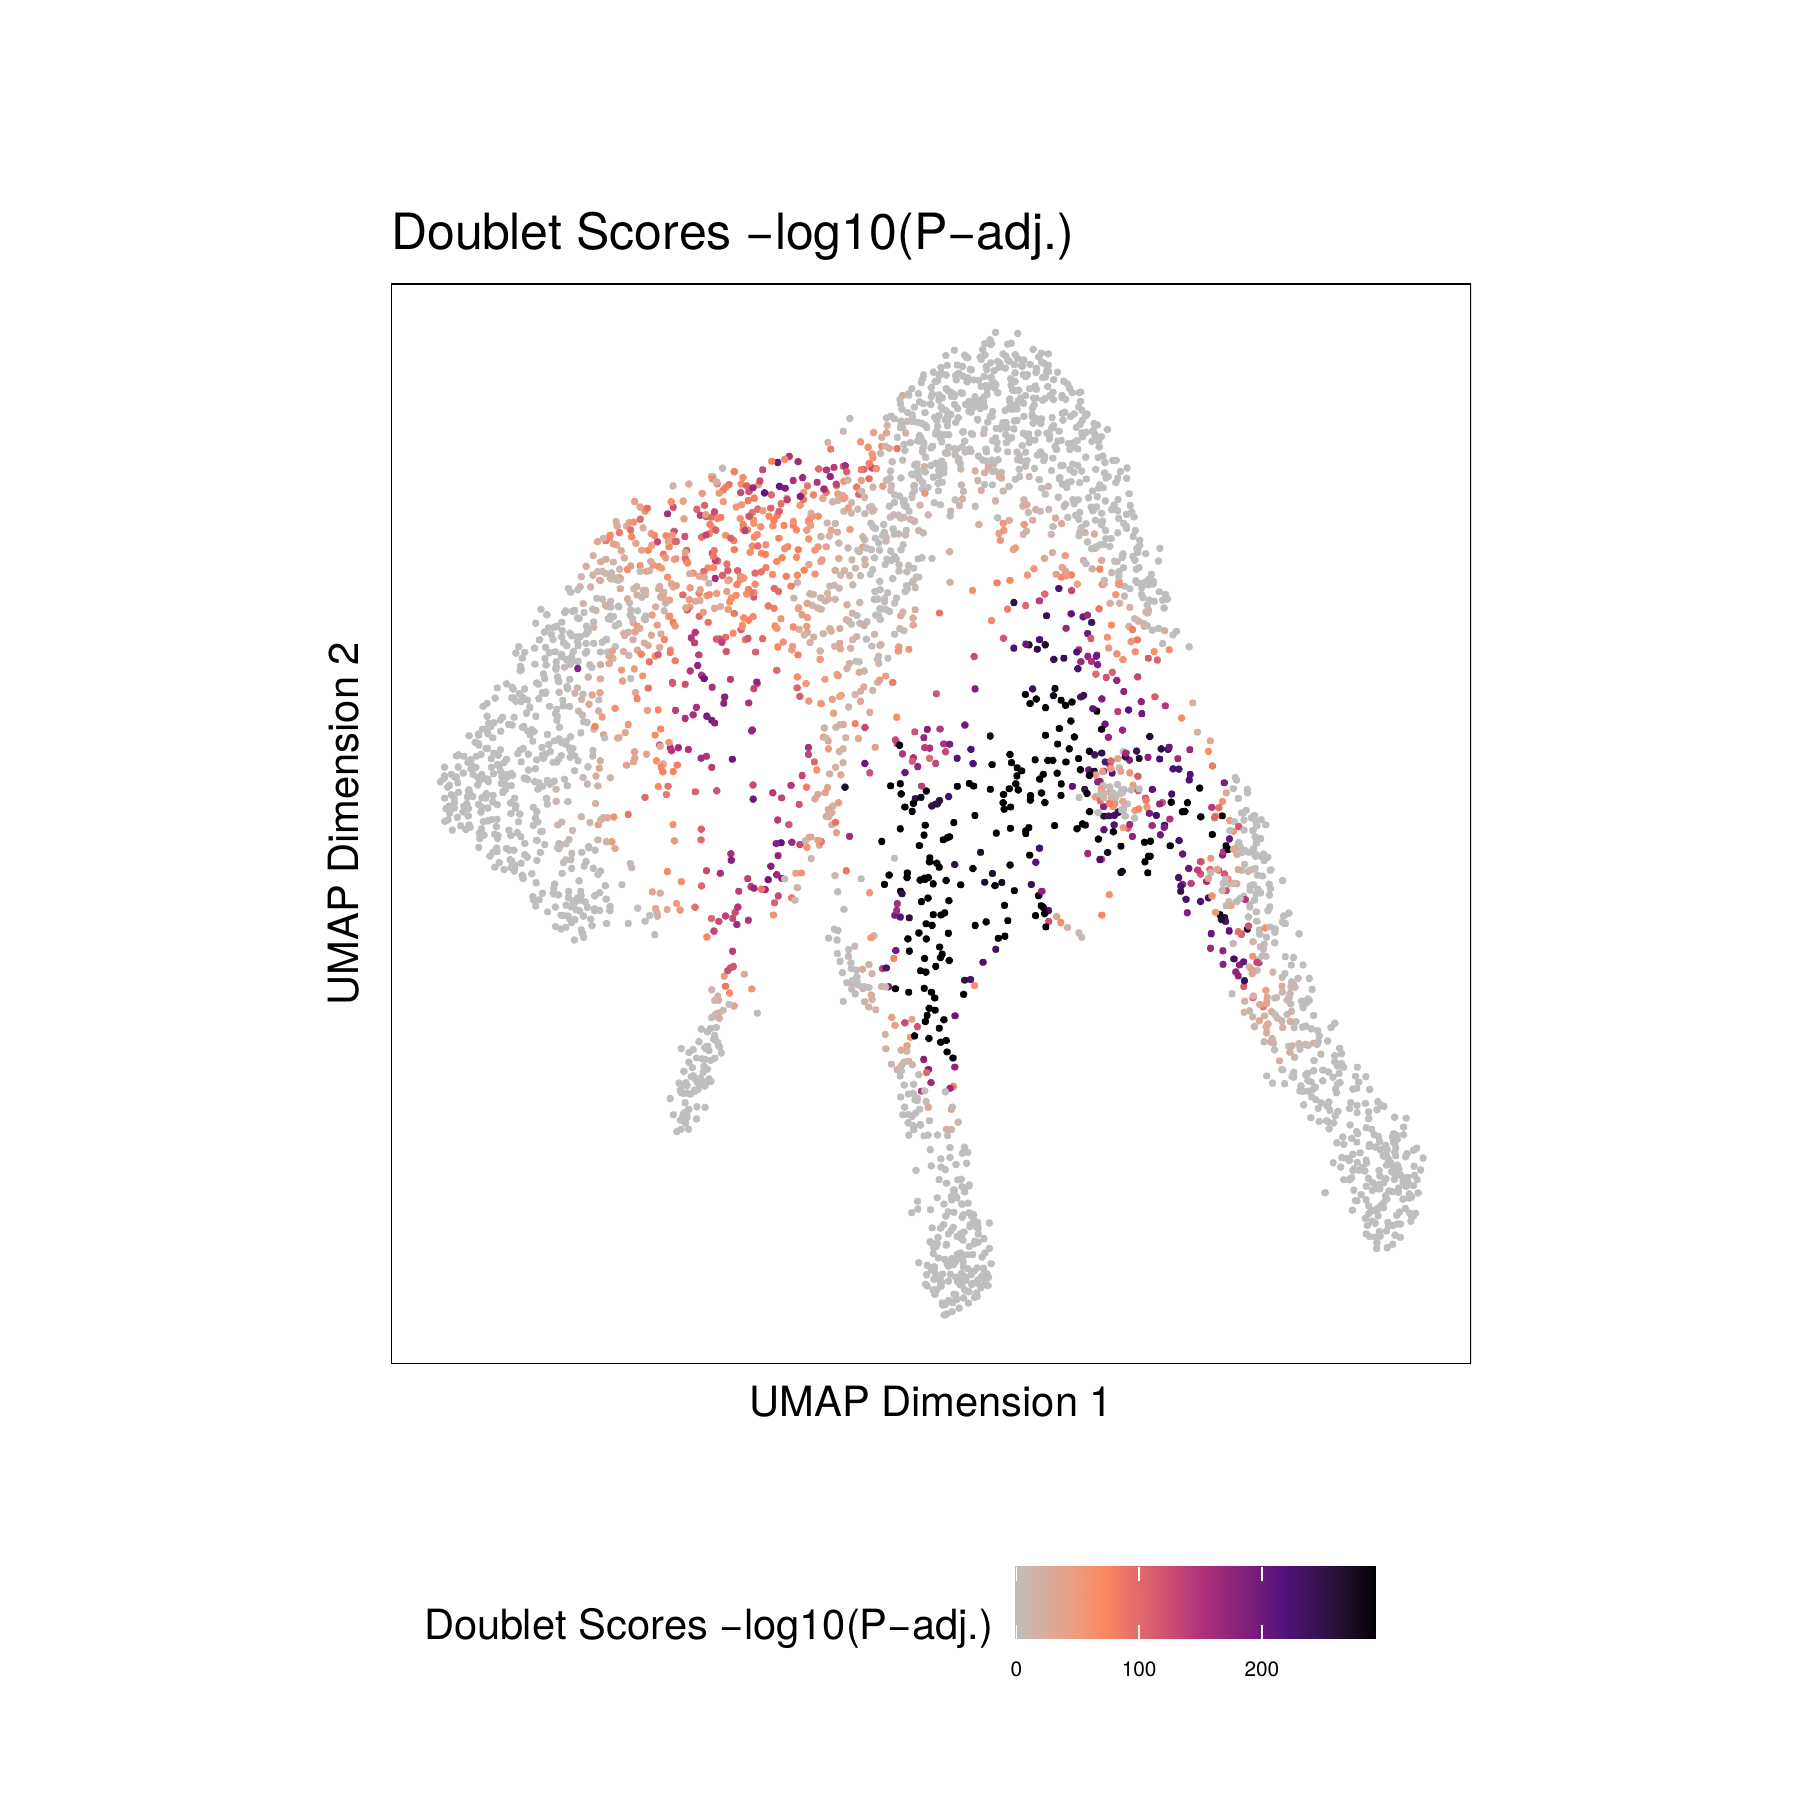
- Doublet Scores - These represent the significance (
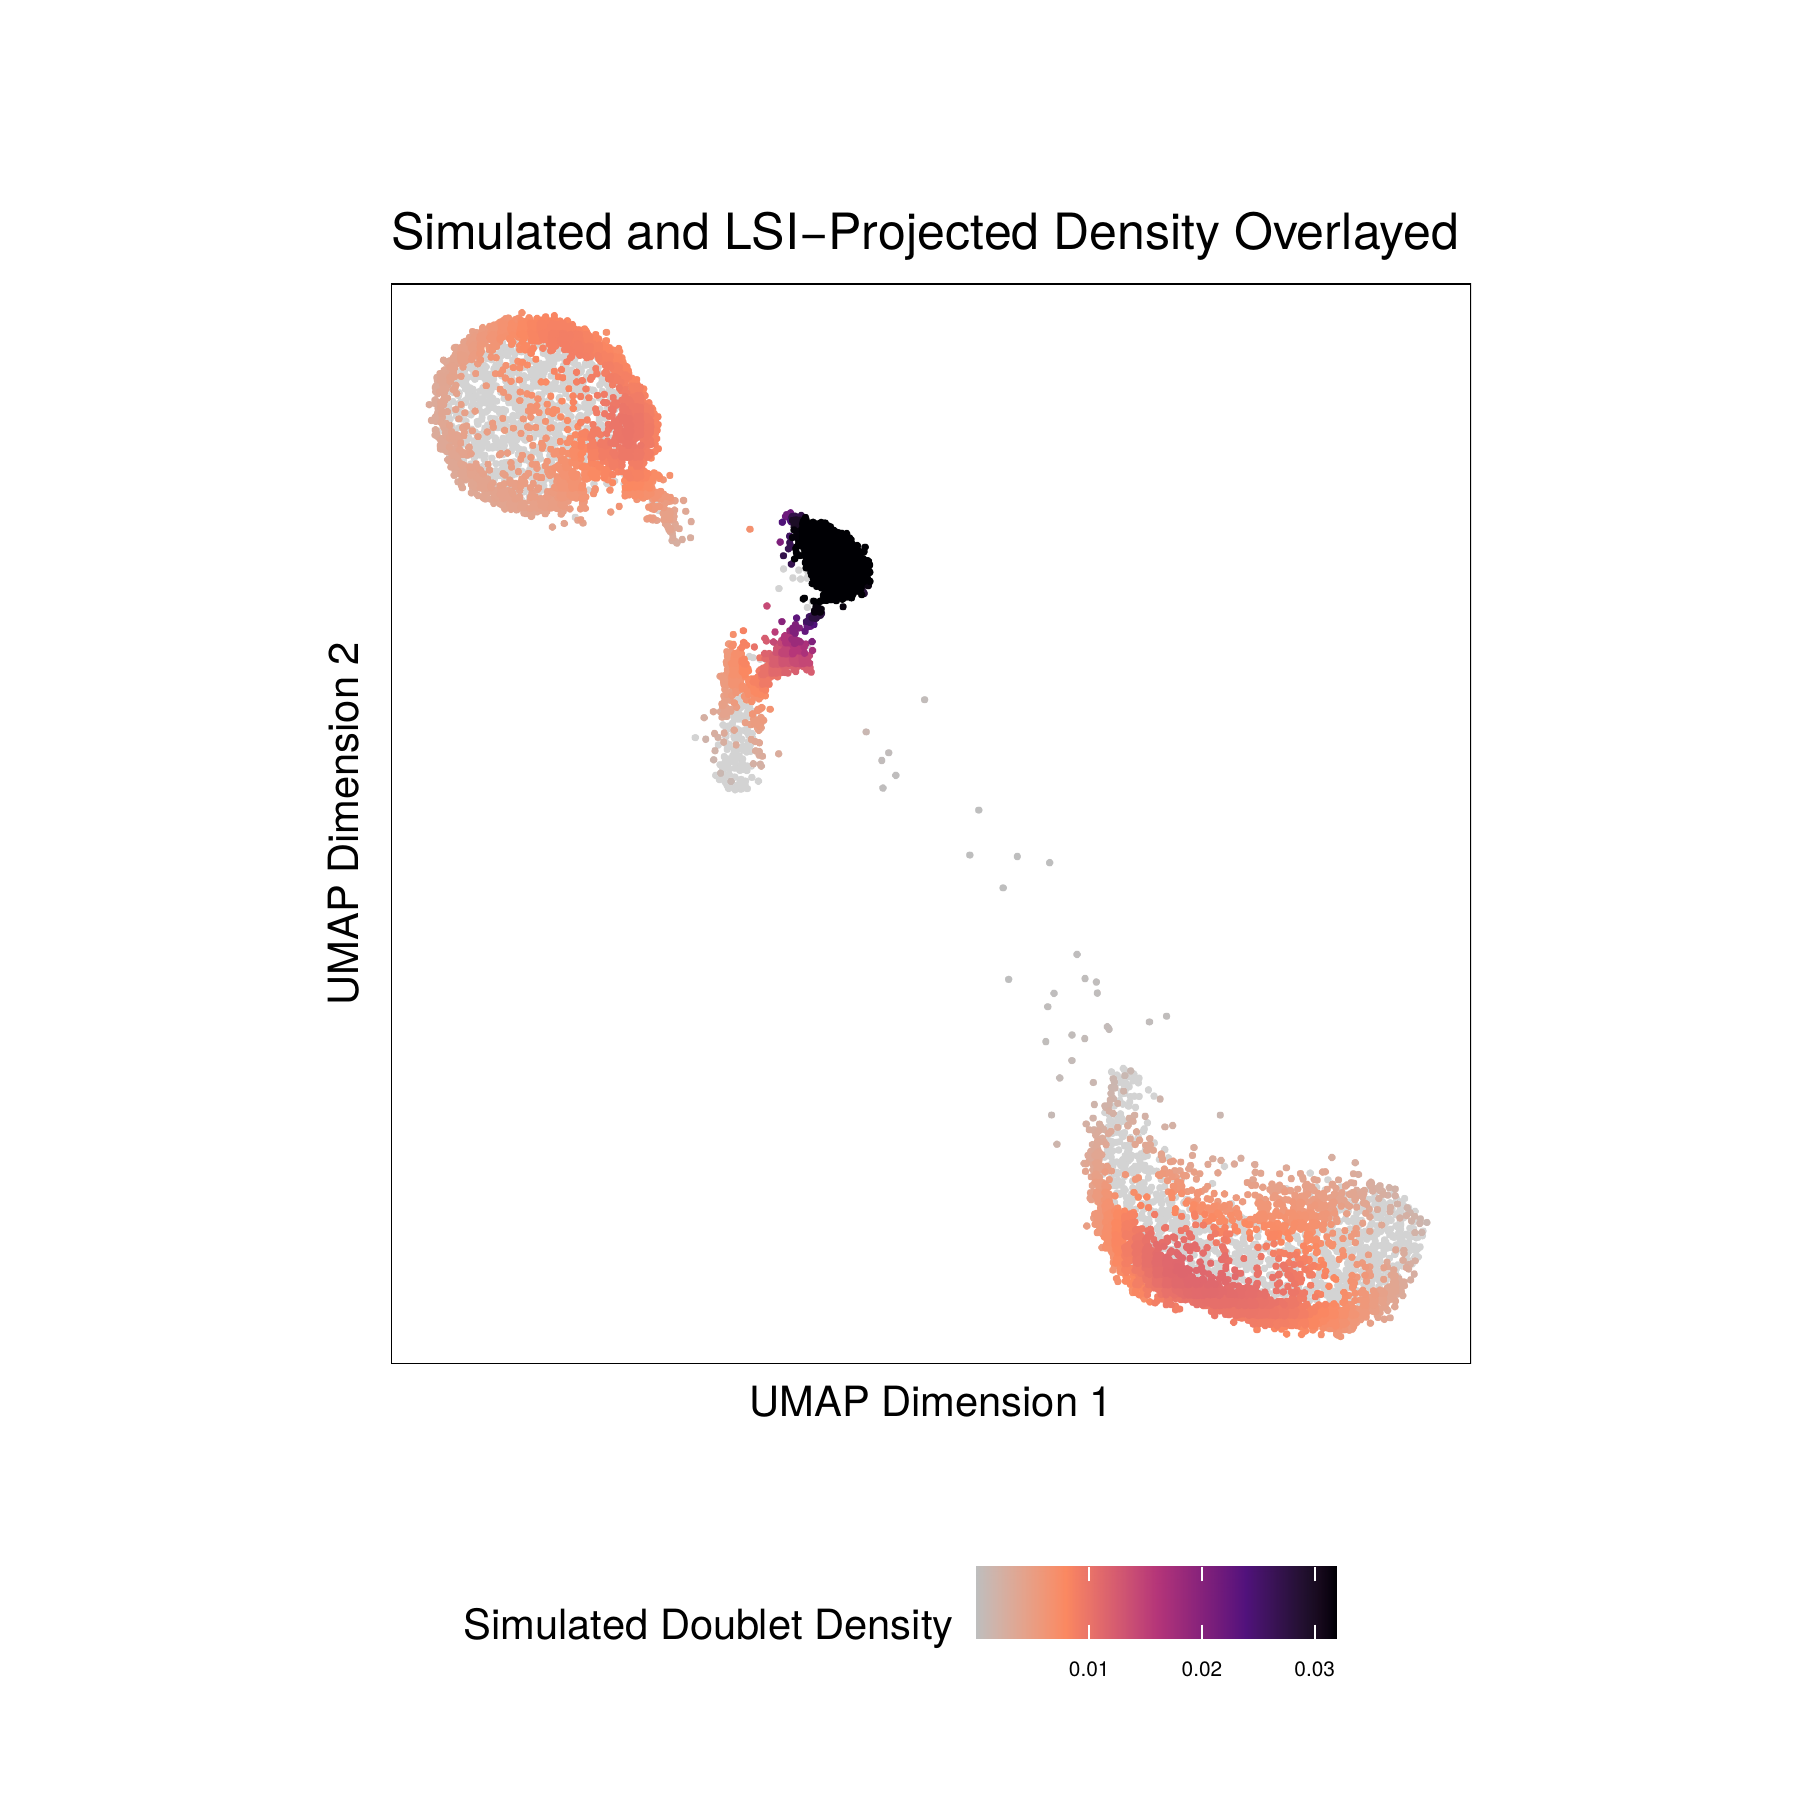
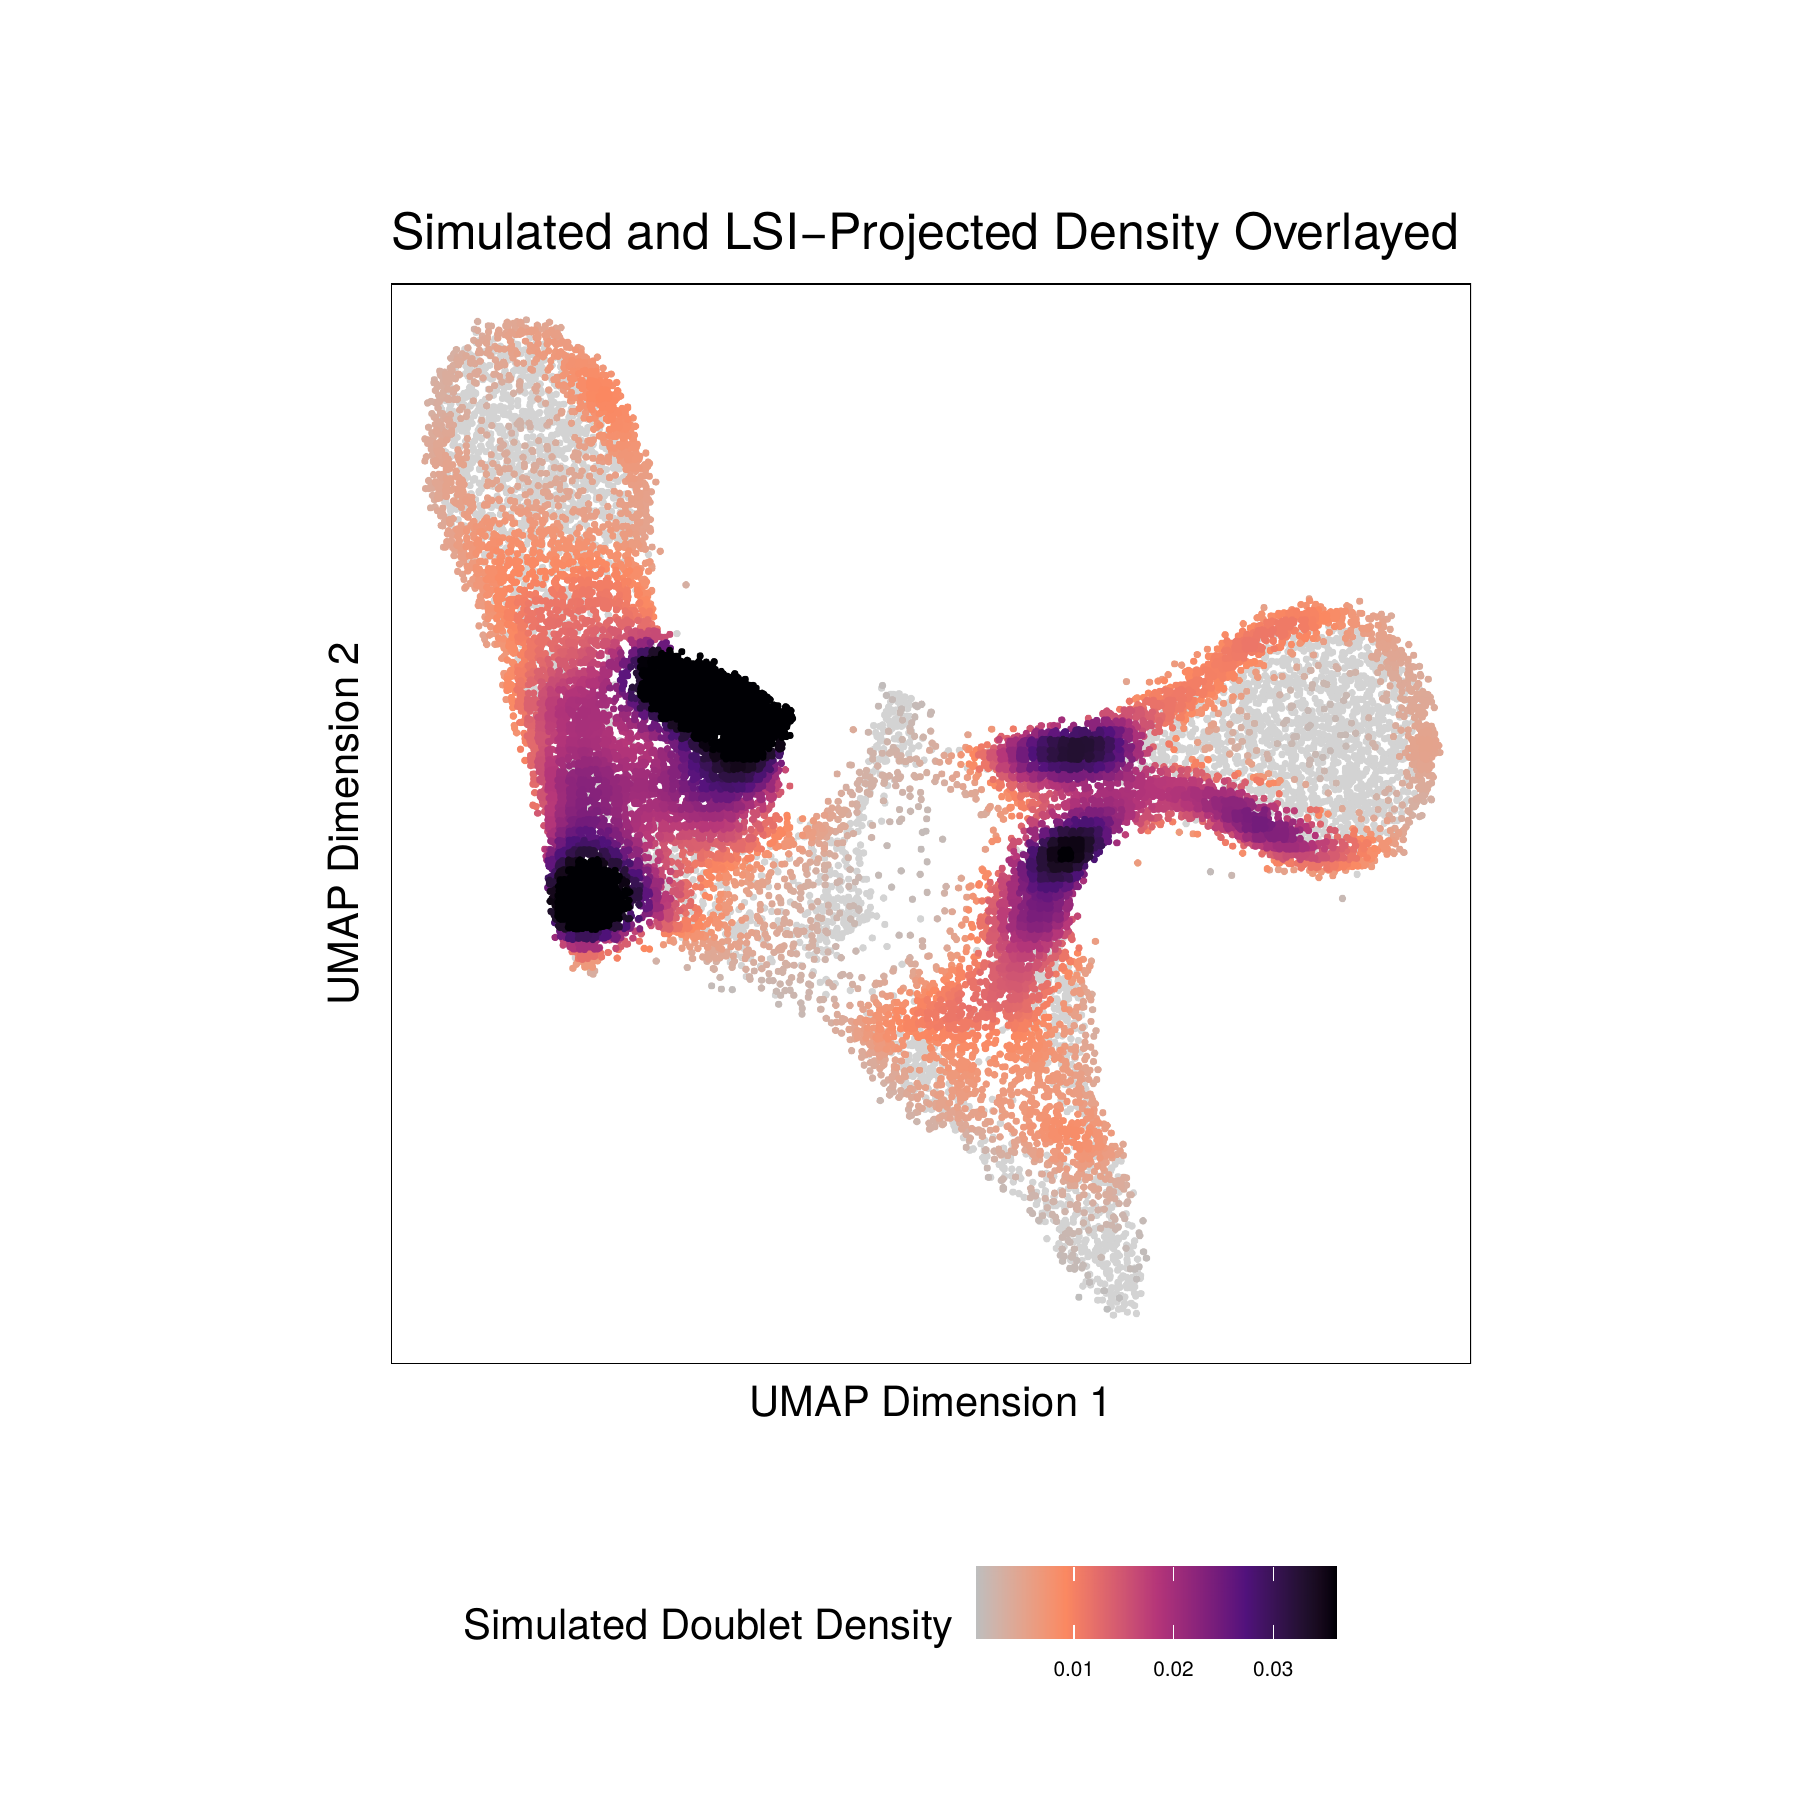
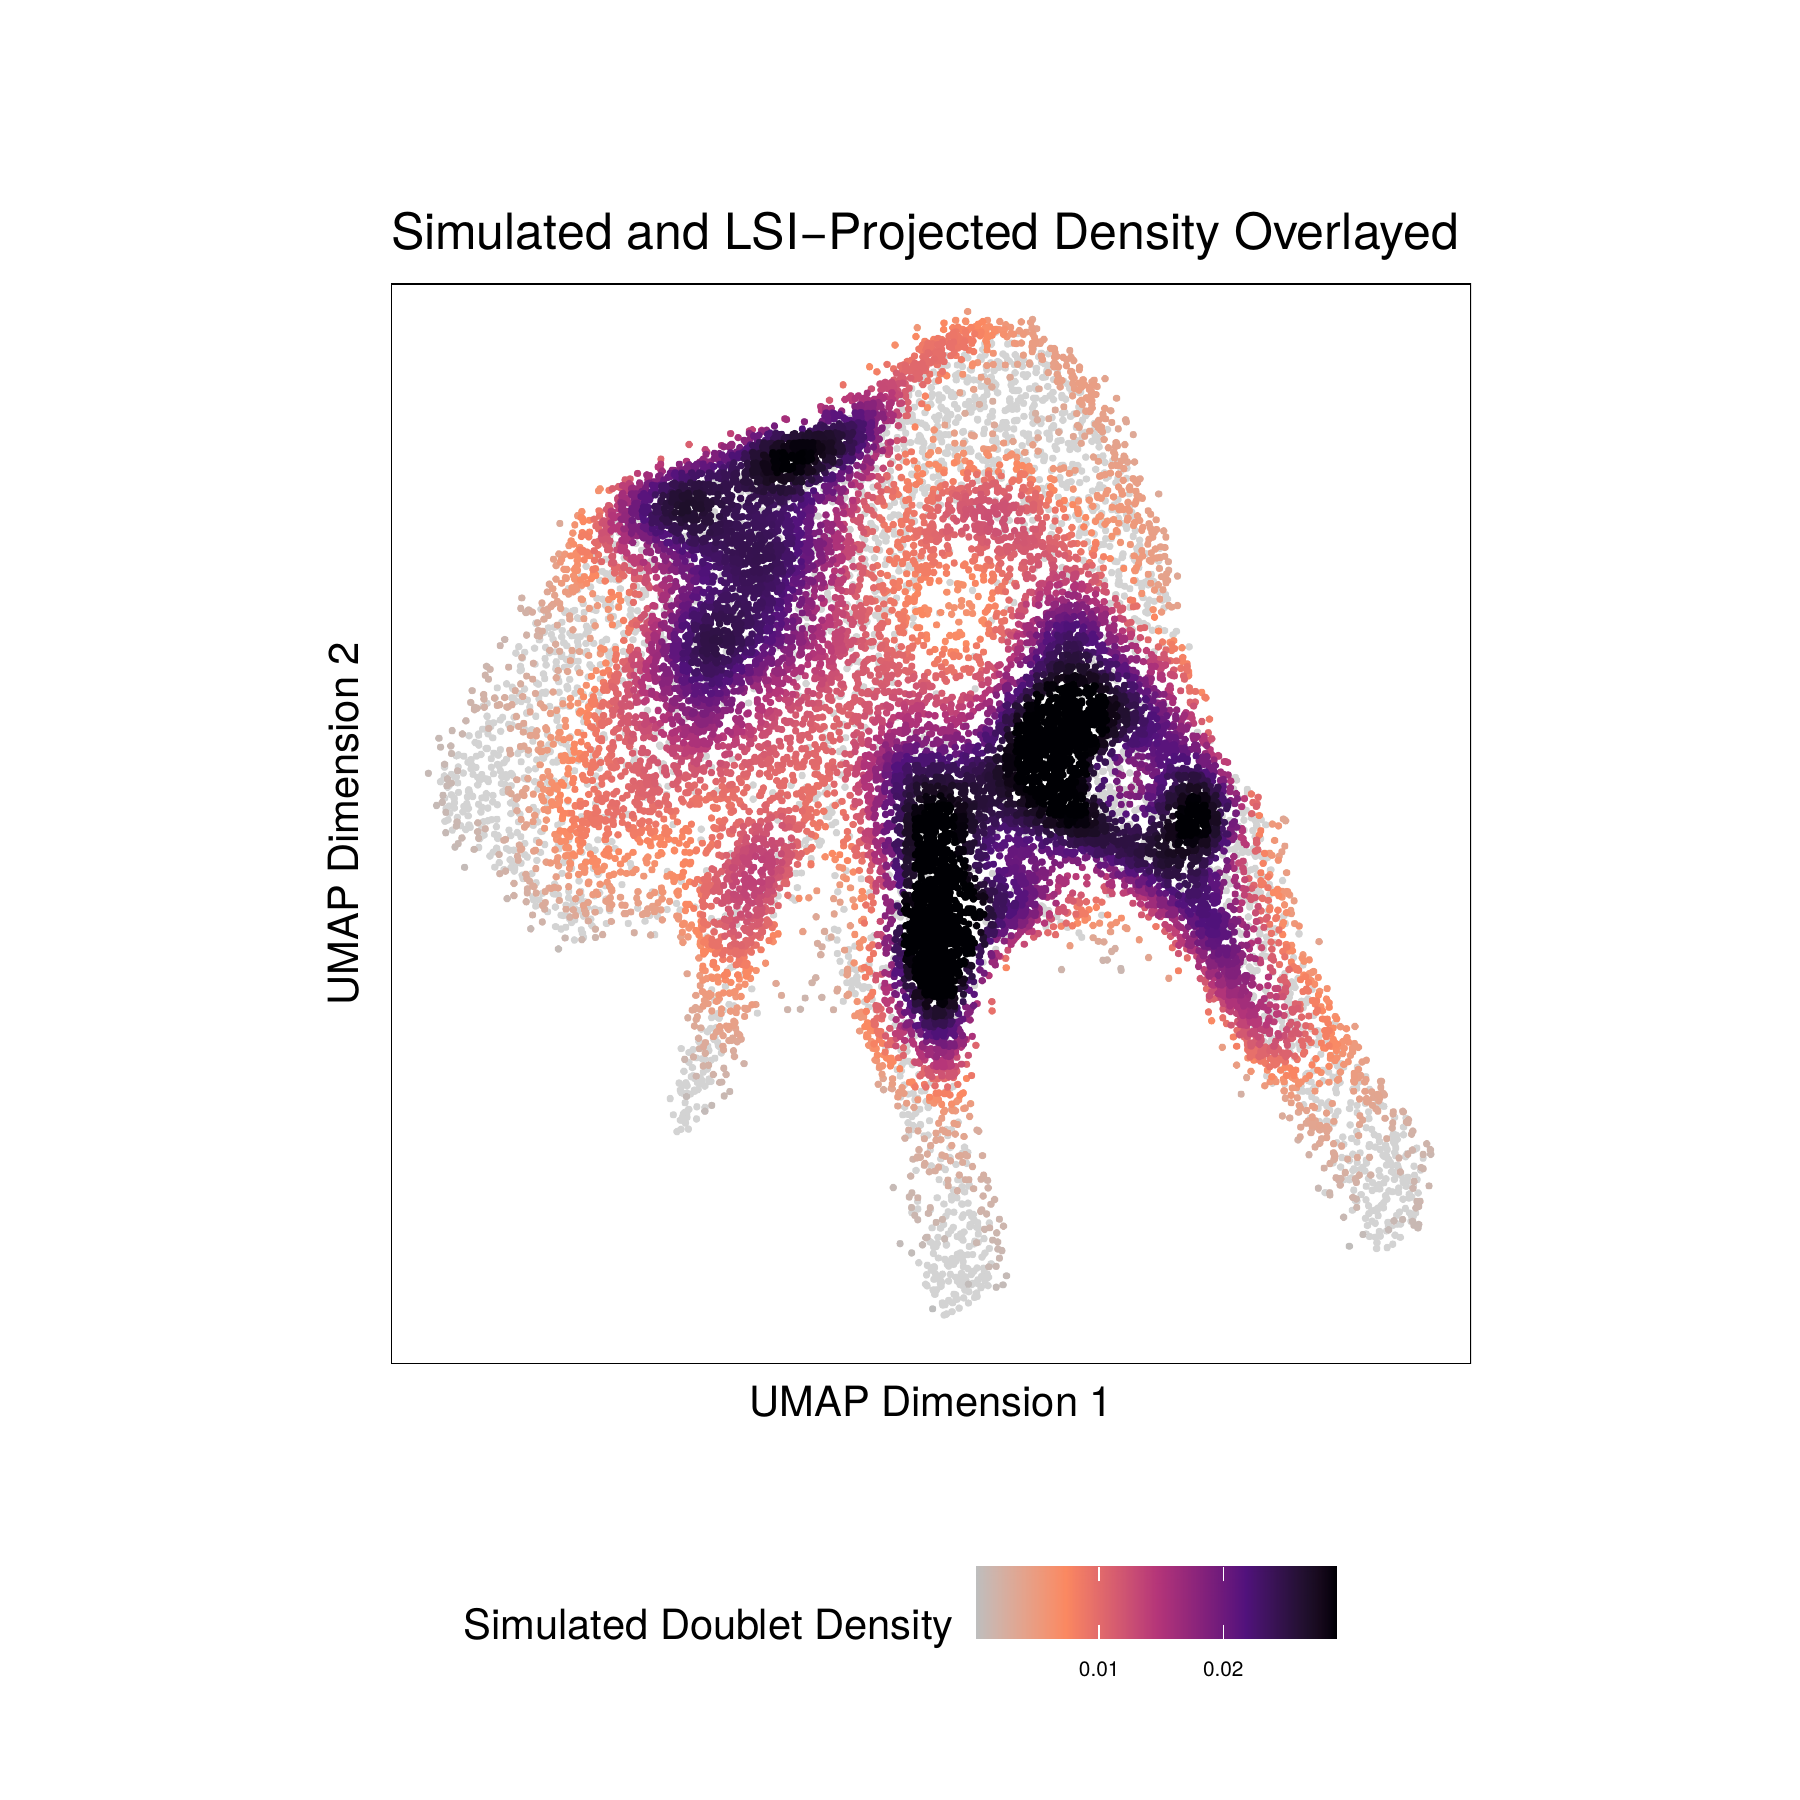
-log10(binomial adjusted p-value)) of simulated doublets nearby each single cell compared to the expected if we assume a uniform distribution. We have found this value to be less consistent than the doublet enrichments and therefore use doublet enrichments for doublet identification. - Doublet Density - This represents the density of the simulated doublet projections. This allows you to visualize where the synthetic doublets were located after projection into your 2-dimensional embedding.
For BMMC :
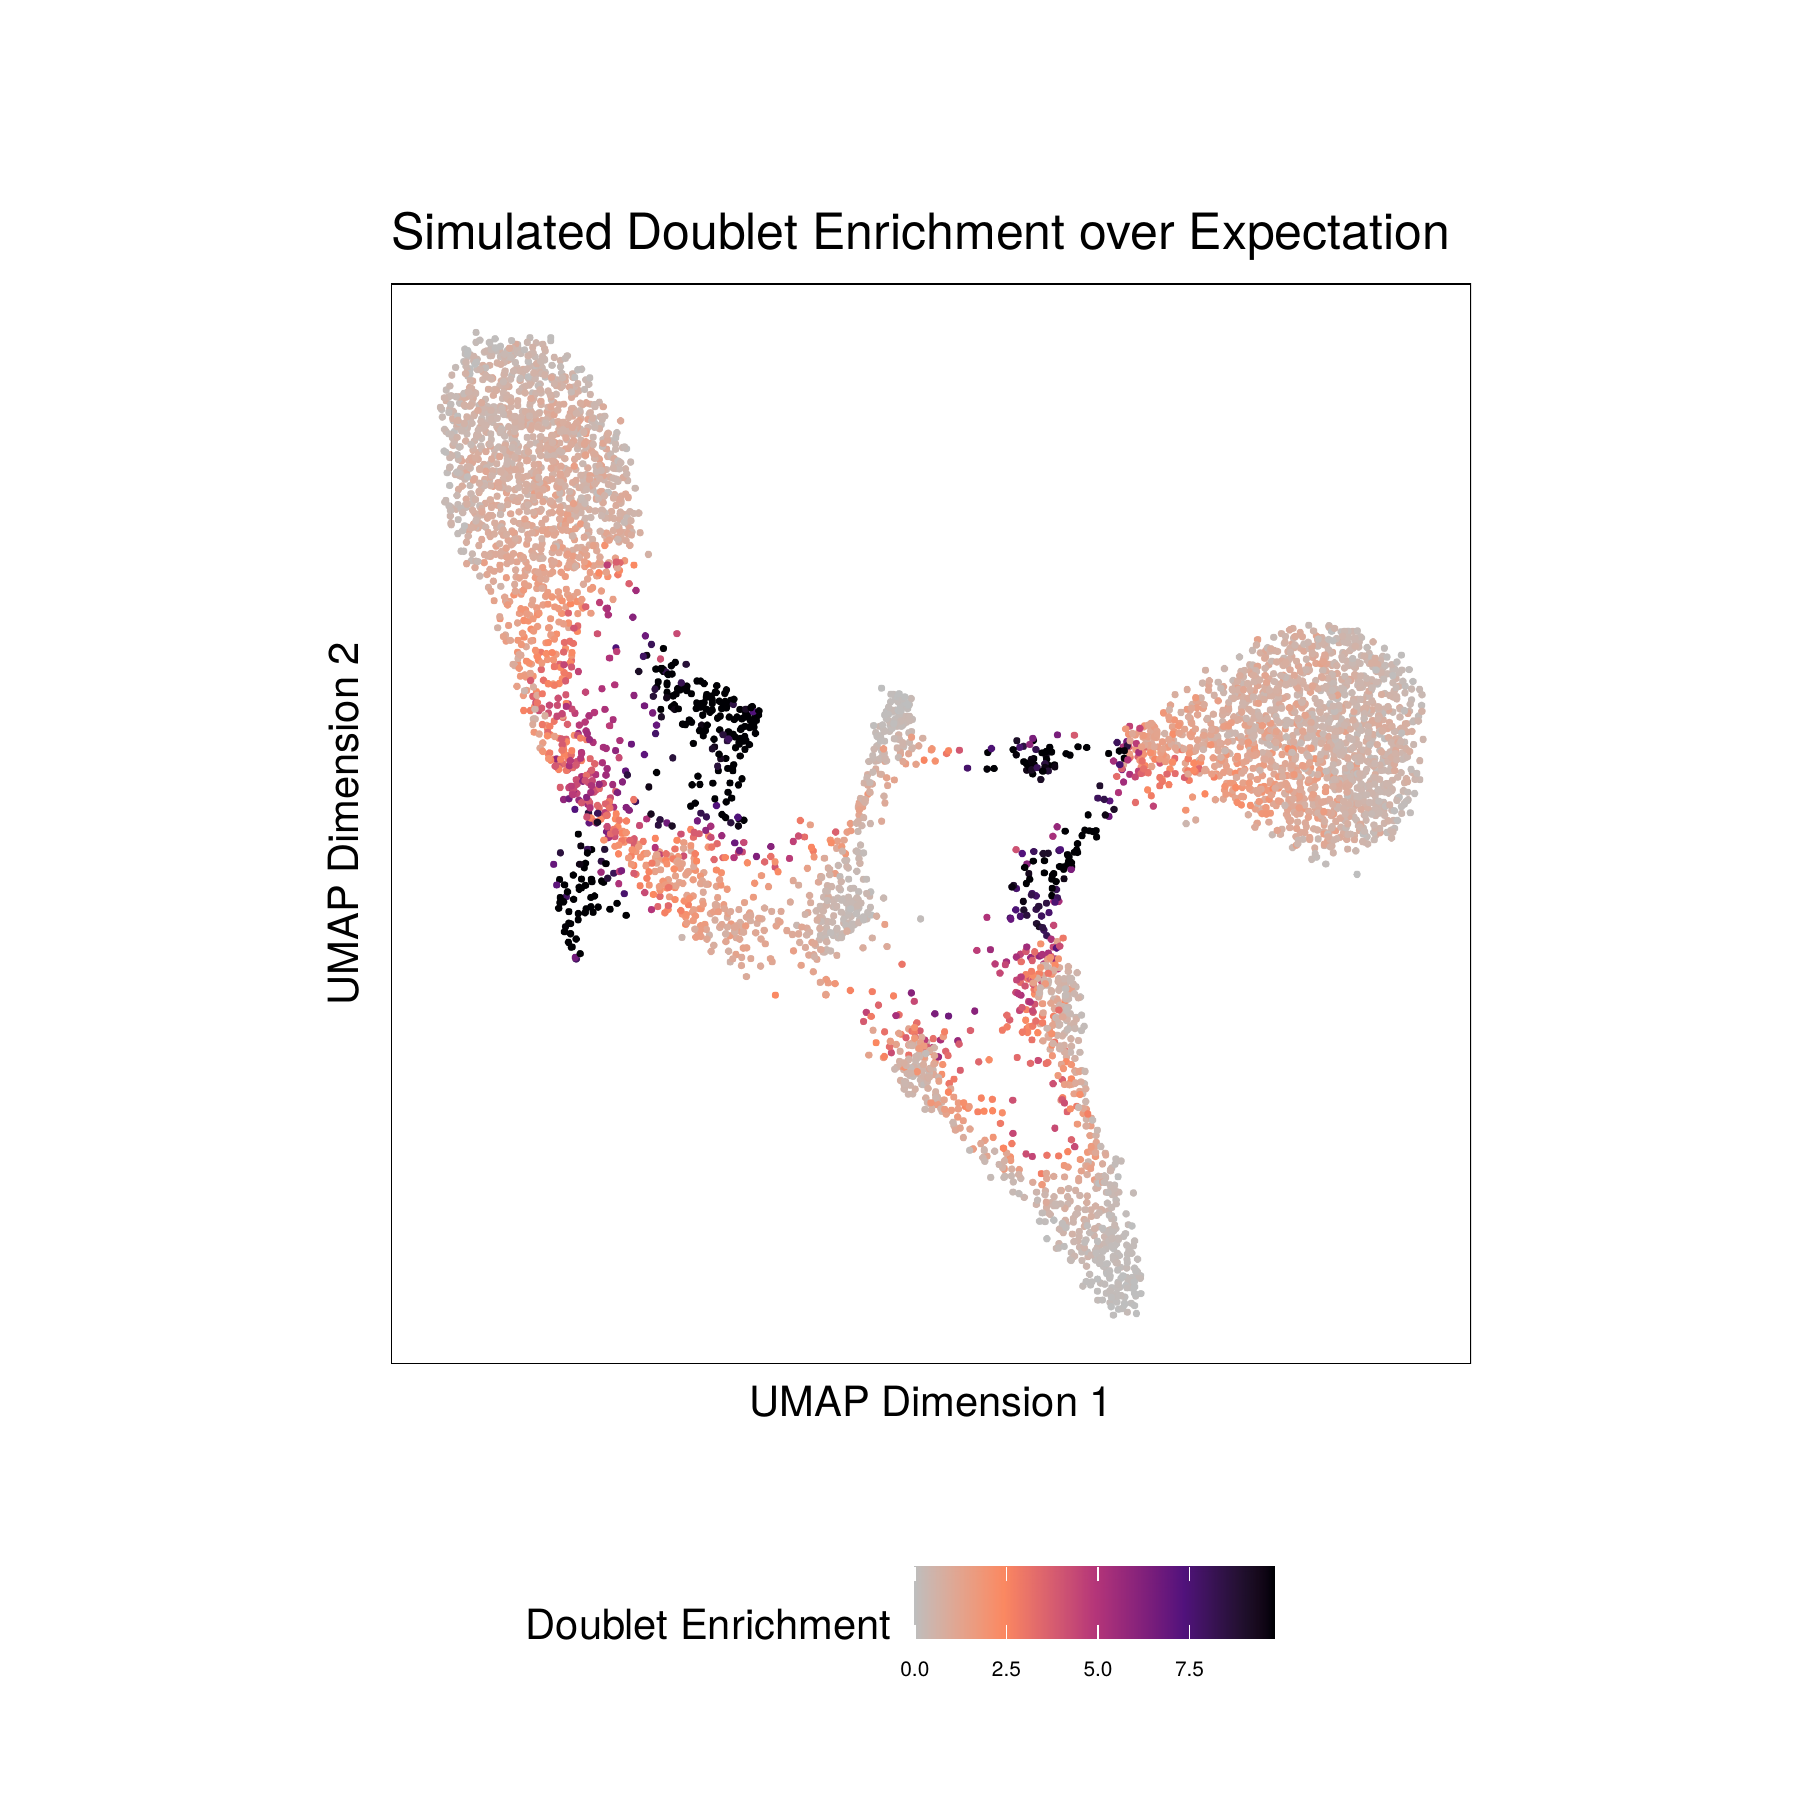
For CD34 BMMC :
For PBMC :