12.2 Motif Enrichment in Marker Peaks
Similar to the motif enrichment analyses performed on the differential peaks in the previous section, we can also perform motif enrichment on our marker peaks identified using getMarkerFeatures().
To do this, we pass our marker peak SummarizedExperiment (markersPeaks) to the peakAnnotationEnrichment() function.
enrichMotifs <- peakAnnoEnrichment(
    seMarker = markersPeaks,
    ArchRProj = projHeme5,
    peakAnnotation = "Motif",
    cutOff = "FDR <= 0.1 & Log2FC >= 0.5"
  )
## 2020-04-15 10:43:01 : Computing Enrichments 1 of 11, 0.046 mins elapsed.
## 2020-04-15 10:43:01 : Computing Enrichments 2 of 11, 0.058 mins elapsed.
## 2020-04-15 10:43:02 : Computing Enrichments 3 of 11, 0.072 mins elapsed.
## 2020-04-15 10:43:03 : Computing Enrichments 4 of 11, 0.094 mins elapsed.
## 2020-04-15 10:43:04 : Computing Enrichments 5 of 11, 0.103 mins elapsed.
## 2020-04-15 10:43:05 : Computing Enrichments 6 of 11, 0.113 mins elapsed.
## 2020-04-15 10:43:05 : Computing Enrichments 7 of 11, 0.121 mins elapsed.
## 2020-04-15 10:43:06 : Computing Enrichments 8 of 11, 0.13 mins elapsed.
## 2020-04-15 10:43:06 : Computing Enrichments 9 of 11, 0.139 mins elapsed.
## 2020-04-15 10:43:07 : Computing Enrichments 10 of 11, 0.148 mins elapsed.
## 2020-04-15 10:43:08 : Computing Enrichments 11 of 11, 0.17 mins elapsed.
The output of peakAnnoEnrichment() is a SummarizedExperiment object containing multiple assays that store the results of enrichment testing with the hypergeometric test.
## class: SummarizedExperiment
## dim: 870 11
## metadata(0):
## assays(10): mlog10Padj mlog10p … CompareFrequency feature
## rownames(870): TFAP2B_1 TFAP2D_2 … TBX18_869 TBX22_870
## rowData names(0):
## colnames(11): B CD4.M … PreB Progenitor
## colData names(0):
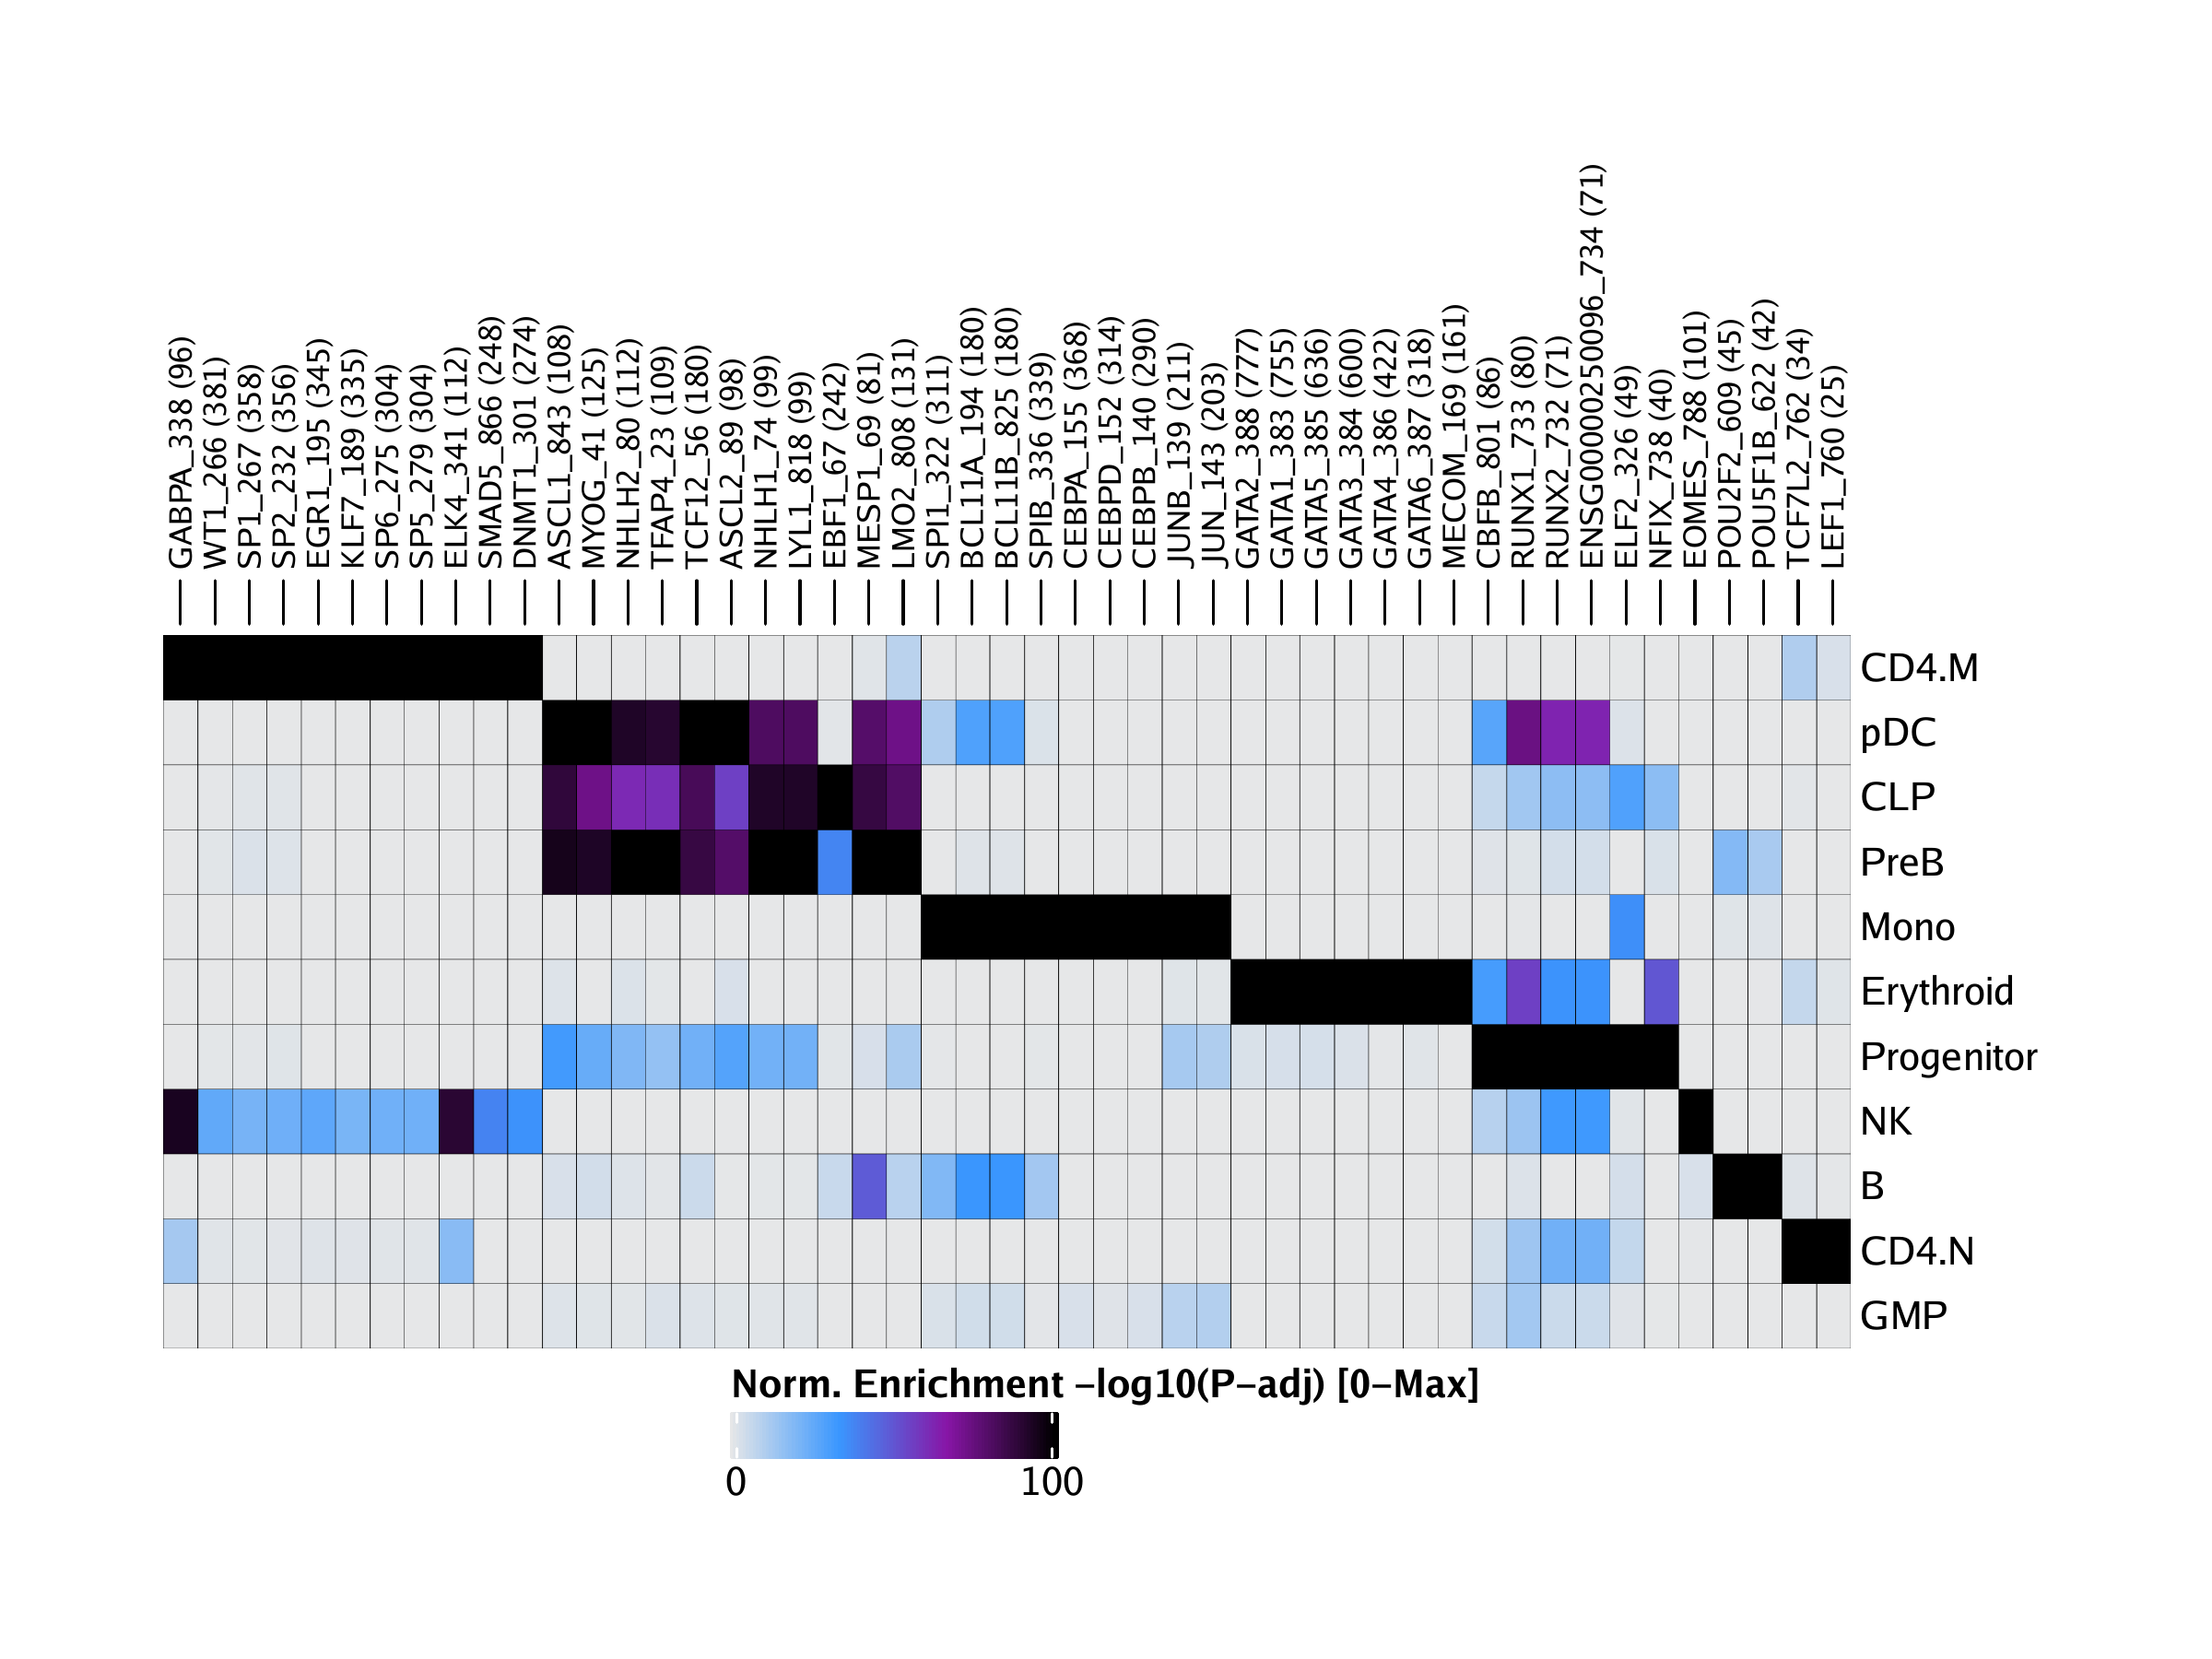
We can directly plot these motif enrichments across all cell groups using the plotEnrichHeatmap() function. In this function, we limit the total number of motifs shown per cell group using the n parameter.
## Adding Annotations..
## Preparing Main Heatmap..
We can diplay this plot using ComplexHeatmap::draw().
To save an editable vectorized version of this plot, we use the plotPDF() function.
plotPDF(heatmapEM, name = "Motifs-Enriched-Marker-Heatmap", width = 8, height = 6, ArchRProj = projHeme5, addDOC = FALSE)## [1] 0